
Page 150 - Applied Statistics Using SPSS, STATISTICA, MATLAB and R
P. 150
130 4 Parametric Tests of Hypotheses
significance level the hypothesis that the respective population variances are
unequal.
*
A: The sample variances are v 1 = 1.680 and v 2 = 0.482; therefore, F = 3.49, with an
observed one-sided significance of p = 0.027. The 0.025 and 0.975 percentiles of
F 9,11 are 0.26 and 3.59, respectively. Therefore, since the non-critical region
[0.26, 3.59] contains p, we do not reject the null hypothesis at the 5% significance
level.
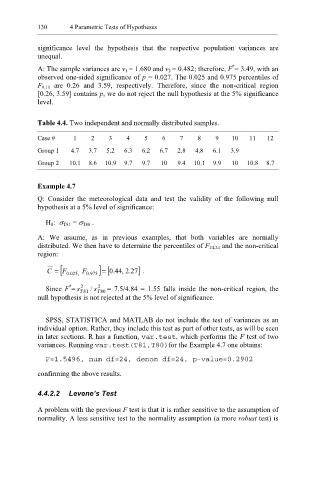
Table 4.4. Two independent and normally distributed samples.
Case # 1 2 3 4 5 6 7 8 9 10 11 12
Group 1 4.7 3.7 5.2 6.3 6.2 6.7 2.8 4.8 6.1 3.9
Group 2 10.1 8.6 10.9 9.7 9.7 10 9.4 10.1 9.9 10 10.8 8.7
Example 4.7
Q: Consider the meteorological data and test the validity of the following null
hypothesis at a 5% level of significance:
H 0: σ T81 = σ T80 .
A: We assume, as in previous examples, that both variables are normally
distributed. We then have to determine the percentiles of F 24,24 and the non-critical
region:
] 44
C = [ . 0 025 , . 0 975 ]F = [ F . 0 . 2 , 27 .
*
Since F = s T 2 81 / s T 2 80 = 7.5/4.84 = 1.55 falls inside the non-critical region, the
null hypothesis is not rejected at the 5% level of significance.
SPSS, STATISTICA and MATLAB do not include the test of variances as an
individual option. Rather, they include this test as part of other tests, as will be seen
in later sections. R has a function, var.test , which performs the F test of two
variances. Running var.test(T81,T80) for the Example 4.7 one obtains:
F=1.5496, num df=24, denom df=24, p-value=0.2902
confirming the above results.
4.4.2.2 Levene’s Test
A problem with the previous F test is that it is rather sensitive to the assumption of
normality. A less sensitive test to the normality assumption (a more robust test) is