
Page 151 - Applied Statistics Using SPSS, STATISTICA, MATLAB and R
P. 151
4.4 Inference on Two Populations 131
Levene’s test, which uses deviations from the sample means. The test is carried out
as follows:
1. Compute the means in the two samples: x and x .
A
B
2. Let d i A = x i A − x A and d B i = x B i − x B represent the absolute deviations
of the sample values around the respective mean.
3. Compute the sample means, d and d , and sample variances, v A and v B
B
A
of the previous absolute deviations.
4. Compute the pooled variance, v p, for the two samples, with n A and n B cases,
as the following weighted average of the individual variances:
(n − ) 1 v + (n − ) 1 v
s 2 p ≡ v p = A A B B . 4.9
n A + n B − 2
5. Finally, perform a t test with the test statistic:
d − d
t * = A B ~ t n − 2 . 4.10
1 1
s p +
n A n B
There is a modification of the Levene’s test that uses the deviations from the
median instead of the mean (see section 7.3.3.2).
Example 4.8
Q: Redo the test of Example 4.7 using Levene’s test.
A: The sample means are x = 5.04 and x = 9.825. Using these sample means, we
2
1
compute the absolute deviations for the two groups shown in Table 4.5.
The sample means and variances of these absolute deviations are: d = 1.06,
1
d = 0.492; v 1 = 0.432, v 2 = 0.235. Applying formula 4.9 we obtain a pooled
2
variance v p = 0.324. Therefore, using formula 4.10, the observed test statistic is
*
t = 2.33 with a two-sided observed significance of 0.03.
Thus, we reject the null hypothesis of equal variances at a 5% significance level.
Notice that this conclusion is the opposite of the one reached in Example 4.7.
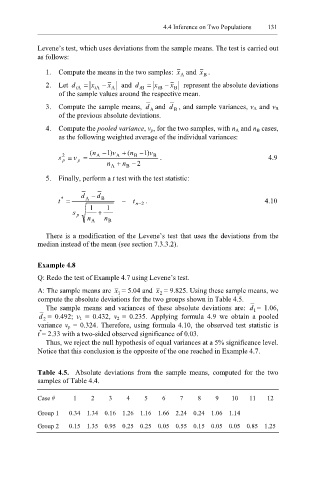
Table 4.5. Absolute deviations from the sample means, computed for the two
samples of Table 4.4.
Case # 1 2 3 4 5 6 7 8 9 10 11 12
Group 1 0.34 1.34 0.16 1.26 1.16 1.66 2.24 0.24 1.06 1.14
Group 2 0.15 1.35 0.95 0.25 0.25 0.05 0.55 0.15 0.05 0.05 0.85 1.25