
Page 24 - Applied Statistics Using SPSS, STATISTICA, MATLAB and R
P. 24
1.1 Deterministic Data and Random Data 3
18
h
16
14
12
10
8
6
4
2
t
0
0 0.2 0.4 0.6 0.8 1 1.2 1.4 1.6
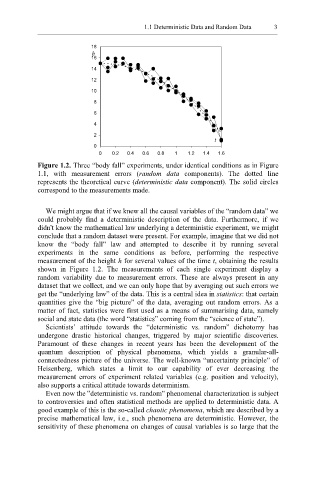
Figure 1.2. Three “body fall” experiments, under identical conditions as in Figure
1.1, with measurement errors (random data components). The dotted line
represents the theoretical curve (deterministic data component). The solid circles
correspond to the measurements made.
We might argue that if we knew all the causal variables of the “random data” we
could probably find a deterministic description of the data. Furthermore, if we
didn t know the mathematical law underlying a deterministic experiment, we might
’
conclude that a random dataset were present. For example, imagine that we did not
know the “body fall” law and attempted to describe it by running several
experiments in the same conditions as before, performing the respective
measurement of the height h for several values of the time t, obtaining the results
shown in Figure 1.2. The measurements of each single experiment display a
random variability due to measurement errors. These are always present in any
dataset that we collect, and we can only hope that by averaging out such errors we
get the “underlying law” of the data. This is a central idea in statistics: that certain
quantities give the “big picture” of the data, averaging out random errors. As a
matter of fact, statistics were first used as a means of summarising data, namely
social and state data (the word “statistics” coming from the “science of state”).
Scientists’ attitude towards the “deterministic vs. random” dichotomy has
undergone drastic historical changes, triggered by major scientific discoveries.
Paramount of these changes in recent years has been the development of the
quantum description of physical phenomena, which yields a granular-all-
connectedness picture of the universe. The well-known “uncertainty principle” of
Heisenberg, which states a limit to our capability of ever decreasing the
measurement errors of experiment related variables (e.g. position and velocity),
also supports a critical attitude towards determinism.
”
“
Even now the deterministic vs. random phenomenal characterization is subject
to controversies and often statistical methods are applied to deterministic data. A
good example of this is the so-called chaotic phenomena, which are described by a
precise mathematical law, i.e., such phenomena are deterministic. However, the
sensitivity of these phenomena on changes of causal variables is so large that the