
Page 28 - Applied Statistics Using SPSS, STATISTICA, MATLAB and R
P. 28
1.2 Population, Sample and Statistics 7
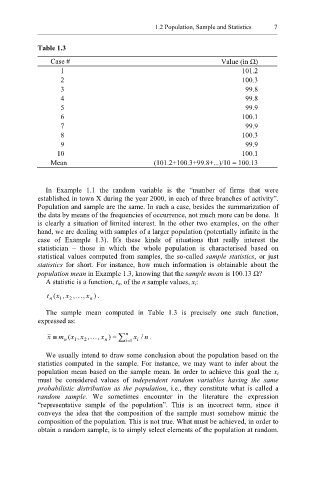
Table 1.3
Case # Value (in Ω)
1 101.2
2 100.3
3 99.8
4 99.8
5 99.9
6 100.1
7 99.9
8 100.3
9 99.9
10 100.1
Mean (101.2+100.3+99.8+...)/10 = 100.13
In Example 1.1 the random variable is the “number of firms that were
established in town X during the year 2000, in each of three branches of activity”.
Population and sample are the same. In such a case, besides the summarization of
the data by means of the frequencies of occurrence, not much more can be done. It
is clearly a situation of limited interest. In the other two examples, on the other
hand, we are dealing with samples of a larger population (potentially infinite in the
case of Example 1.3). It s these kinds of situations that really interest the
’
statistician – those in which the whole population is characterised based on
statistical values computed from samples, the so-called sample statistics, or just
statistics for short. For instance, how much information is obtainable about the
population mean in Example 1.3, knowing that the sample mean is 100.13 Ω?
A statistic is a function, t n, of the n sample values, x i:
t n (x 1 , x 2 ,K , x n ) .
The sample mean computed in Table 1.3 is precisely one such function,
expressed as:
x ≡ m ( x , x ,K , x ) = ∑ n = i 1 x i n / .
n
2
n
1
We usually intend to draw some conclusion about the population based on the
statistics computed in the sample. For instance, we may want to infer about the
population mean based on the sample mean. In order to achieve this goal the x i
must be considered values of independent random variables having the same
probabilistic distribution as the population, i.e., they constitute what is called a
random sample. We sometimes encounter in the literature the expression
“representative sample of the population”. This is an incorrect term, since it
conveys the idea that the composition of the sample must somehow mimic the
composition of the population. This is not true. What must be achieved, in order to
obtain a random sample, is to simply select elements of the population at random.