
Page 27 - Applied Statistics Using SPSS, STATISTICA, MATLAB and R
P. 27
6 1 Introduction
randomly drawn samples can one expect to arrive at legitimate conclusions, about
the whole population, from the data analyses.
Let us now consider the following three examples of datasets:
Example 1.1
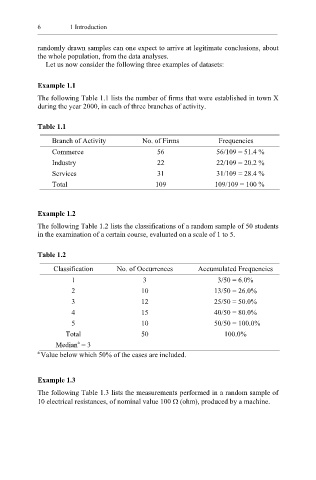
The following Table 1.1 lists the number of firms that were established in town X
during the year 2000, in each of three branches of activity.
Table 1.1
Branch of Activity No. of Firms Frequencies
Commerce 56 56/109 = 51.4 %
Industry 22 22/109 = 20.2 %
Services 31 31/109 = 28.4 %
Total 109 109/109 = 100 %
Example 1.2
The following Table 1.2 lists the classifications of a random sample of 50 students
in the examination of a certain course, evaluated on a scale of 1 to 5.
Table 1.2
Classification No. of Occurrences Accumulated Frequencies
1 3 3/50 = 6.0%
2 10 13/50 = 26.0%
3 12 25/50 = 50.0%
4 15 40/50 = 80.0%
5 10 50/50 = 100.0%
Total 50 100.0%
a
Median = 3
a Value below which 50% of the cases are included.
Example 1.3
The following Table 1.3 lists the measurements performed in a random sample of
10 electrical resistances, of nominal value 100 Ω (ohm), produced by a machine.