
Page 26 - Applied Statistics Using SPSS, STATISTICA, MATLAB and R
P. 26
1.2 Population, Sample and Statistics 5
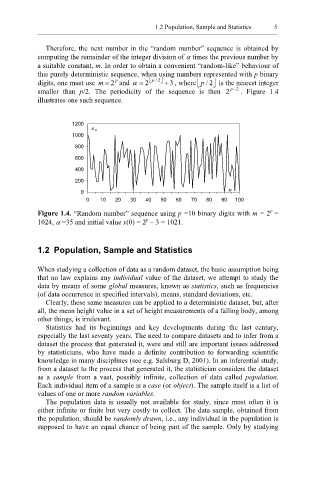
Therefore, the next number in the “random number” sequence is obtained by
computing the remainder of the integer division of α times the previous number by
a suitable constant, m. In order to obtain a convenient “random-like” behaviour of
this purely deterministic sequence, when using numbers represented with p binary
p
digits, one must use m = 2 and α = 2 /p 2 + 3 , where / 2 is the nearest integer
p
smaller than p/2. The periodicity of the sequence is then 2 p − 2 . Figure 1.4
illustrates one such sequence.
1200
x n
1000
800
600
400
200
0 n
0 10 20 30 40 50 60 70 80 90 100
p
Figure 1.4. “Random number” sequence using p =10 binary digits with m = 2 =
p
1024, α =35 and initial value x(0) = 2 – 3 = 1021.
1.2 Population, Sample and Statistics
When studying a collection of data as a random dataset, the basic assumption being
that no law explains any individual value of the dataset, we attempt to study the
data by means of some global measures, known as statistics, such as frequencies
(of data occurrence in specified intervals), means, standard deviations, etc.
Clearly, these same measures can be applied to a deterministic dataset, but, after
all, the mean height value in a set of height measurements of a falling body, among
other things, is irrelevant.
Statistics had its beginnings and key developments during the last century,
especially the last seventy years. The need to compare datasets and to infer from a
dataset the process that generated it, were and still are important issues addressed
by statisticians, who have made a definite contribution to forwarding scientific
knowledge in many disciplines (see e.g. Salsburg D, 2001). In an inferential study,
from a dataset to the process that generated it, the statistician considers the dataset
as a sample from a vast, possibly infinite, collection of data called population.
Each individual item of a sample is a case (or object). The sample itself is a list of
values of one or more random variables.
The population data is usually not available for study, since most often it is
either infinite or finite but very costly to collect. The data sample, obtained from
the population, should be randomly drawn, i.e., any individual in the population is
supposed to have an equal chance of being part of the sample. Only by studying