
Page 281 - Applied Statistics Using SPSS, STATISTICA, MATLAB and R
P. 281
262 6 Statistical Classification
performance of about 86% (see Exercise 6.5). This is a comparable result to the
one obtained with the tree classifier.
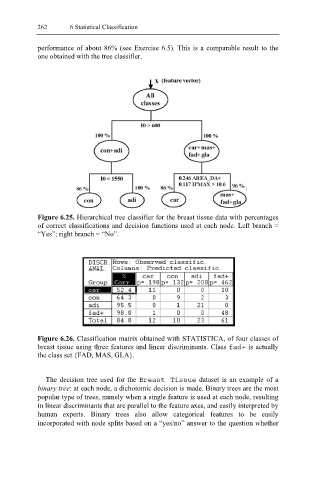
Figure 6.25. Hierarchical tree classifier for the breast tissue data with percentages
of correct classifications and decision functions used at each node. Left branch =
“Yes”; right branch = “No”.
Figure 6.26. Classification matrix obtained with STATISTICA, of four classes of
breast tissue using three features and linear discriminants. Class fad+ is actually
the class set {FAD, MAS, GLA}.
The decision tree used for the Breast Tissue dataset is an example of a
binary tree: at each node, a dichotomic decision is made. Binary trees are the most
popular type of trees, namely when a single feature is used at each node, resulting
in linear discriminants that are parallel to the feature axes, and easily interpreted by
human experts. Binary trees also allow categorical features to be easily
incorporated with node splits based on a “yes/no” answer to the question whether