
Page 279 - Applied Statistics Using SPSS, STATISTICA, MATLAB and R
P. 279
260 6 Statistical Classification
At each stage of the tree classifier, a simpler problem with a smaller number of
features is solved. This is an additional benefit, namely in practical multi-class
problems where it is rather difficult to guarantee normal or even symmetric
distributions with similar covariance matrices for all classes, but it may be
possible, with the multistage approach, that those conditions are approximately met
at each stage, affording then optimal classifiers.
Example 6.16
Q: Consider the Breast Tissue dataset (electric impedance measurements of
freshly excised breast tissue) with 6 classes denoted CAR (carcinoma), FAD
(fibro-adenoma), GLA (glandular), MAS (mastopathy), CON (connective) and
ADI (adipose). Derive a decision tree solution for this classification problem.
A: Performing a Kruskal-Wallis analysis, it is readily seen that all the features have
discriminative capabilities, namely I0 and PA500, and that it is practically
impossible to discriminate between classes GLA, FAD and MAS. The low
dimensionality ratio of this dataset for the individual classes (e.g. only 14 cases for
class CON) strongly recommends a decision tree approach, with the use of merged
classes and a greatly reduced number of features at each node.
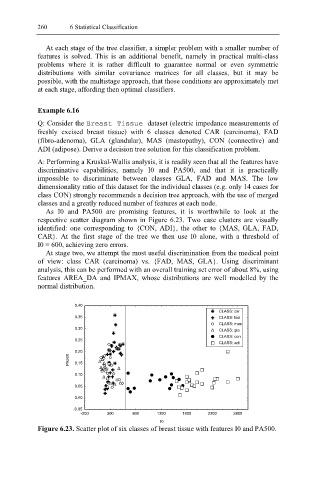
As I0 and PA500 are promising features, it is worthwhile to look at the
respective scatter diagram shown in Figure 6.23. Two case clusters are visually
identified: one corresponding to {CON, ADI}, the other to {MAS, GLA, FAD,
CAR}. At the first stage of the tree we then use I0 alone, with a threshold of
I0 = 600, achieving zero errors.
At stage two, we attempt the most useful discrimination from the medical point
of view: class CAR (carcinoma) vs. {FAD, MAS, GLA}. Using discriminant
analysis, this can be performed with an overall training set error of about 8%, using
features AREA_DA and IPMAX, whose distributions are well modelled by the
normal distribution.
0.40
CLASS: car
0.35 CLASS: fad
CLASS: mas
0.30
CLASS: gla
CLASS: con
0.25
CLASS: adi
0.20
PA500 0.15
0.10
0.05
0.00
-0.05
-200 300 800 1300 1800 2300 2800
I0
Figure 6.23. Scatter plot of six classes of breast tissue with features I0 and PA500.