
Page 277 - Applied Statistics Using SPSS, STATISTICA, MATLAB and R
P. 277
258 6 Statistical Classification
Statistical software products such as SPSS and STATISTICA allow the
selection of the cases used for training and for testing linear discriminant
classifiers. With SPSS, it is possible to use a selection variable, easing the task of
specifying randomly selected samples. SPSS also affords performing a leave-one-
out classification. With STATISTICA, one can initially select the cases used for
training (Selection Conditions option in the Too ls menu), and once the
classifier is designed, specify test cases (Select Cases button in the
Classification tab of the command window). In MATLAB and R one may
create a case-selecting vector, called a filter, with random 0s and 1s.
Example 6.14
Q: Consider the two-class cork-stopper classifier, with two features, presented in
section 6.2.2 (see classification matrix in Table 6.3). Evaluate the performance of
this classifier using the partition method with k = 3, and the leave-one-out method.
A: Using the partition method with k = 3, a test set estimate of Pe t = 9.9 % was
obtained, which is near the training set error estimate of 10%. The leave-one-out
method also produces Pe t = 10 % (see Table 6.11; the “Original” matrix is the
training set estimate, the “Cross-validated” matrix is the test set estimate). The
closeness of these figures is an indication of reliable error estimation for this high
dimensionality ratio classification problem (n/d = 25). Using formula 6.28 the 95%
confidence limits for these error estimates are: s = 0.03 ⇒ Pe = 10% ± 5.9%.
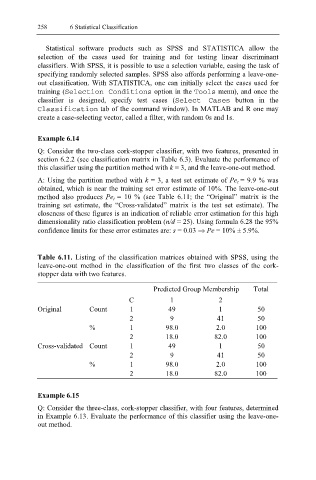
Table 6.11. Listing of the classification matrices obtained with SPSS, using the
leave-one-out method in the classification of the first two classes of the cork-
stopper data with two features.
Predicted Group Membership Total
C 1 2
Original Count 1 49 1 50
2 9 41 50
% 1 98.0 2.0 100
2 18.0 82.0 100
Cross-validated Count 1 49 1 50
2 9 41 50
% 1 98.0 2.0 100
2 18.0 82.0 100
Example 6.15
Q: Consider the three-class, cork-stopper classifier, with four features, determined
in Example 6.13. Evaluate the performance of this classifier using the leave-one-
out method.