
Page 280 - Applied Statistics Using SPSS, STATISTICA, MATLAB and R
P. 280
6.7 Tree Classifiers 261
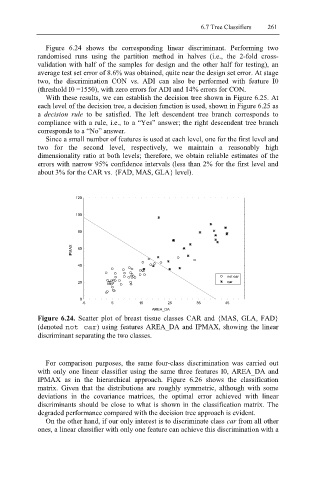
Figure 6.24 shows the corresponding linear discriminant. Performing two
randomised runs using the partition method in halves (i.e., the 2-fold cross-
validation with half of the samples for design and the other half for testing), an
average test set error of 8.6% was obtained, quite near the design set error. At stage
two, the discrimination CON vs. ADI can also be performed with feature I0
(threshold I0 =1550), with zero errors for ADI and 14% errors for CON.
With these results, we can establish the decision tree shown in Figure 6.25. At
each level of the decision tree, a decision function is used, shown in Figure 6.25 as
a decision rule to be satisfied. The left descendent tree branch corresponds to
compliance with a rule, i.e., to a “Yes” answer; the right descendent tree branch
corresponds to a “No” answer.
Since a small number of features is used at each level, one for the first level and
two for the second level, respectively, we maintain a reasonably high
dimensionality ratio at both levels; therefore, we obtain reliable estimates of the
errors with narrow 95% confidence intervals (less than 2% for the first level and
about 3% for the CAR vs. {FAD, MAS, GLA} level).
120
100
80
IPMAX 60
40
not car
20 car
0
-5 5 15 25 35 45
AREA_DA
Figure 6.24. Scatter plot of breast tissue classes CAR and {MAS, GLA, FAD}
(denoted not car ) using features AREA_DA and IPMAX, showing the linear
discriminant separating the two classes.
For comparison purposes, the same four-class discrimination was carried out
with only one linear classifier using the same three features I0, AREA_DA and
IPMAX as in the hierarchical approach. Figure 6.26 shows the classification
matrix. Given that the distributions are roughly symmetric, although with some
deviations in the covariance matrices, the optimal error achieved with linear
discriminants should be close to what is shown in the classification matrix. The
degraded performance compared with the decision tree approach is evident.
On the other hand, if our only interest is to discriminate class car from all other
ones, a linear classifier with only one feature can achieve this discrimination with a