
Page 274 - Applied Statistics Using SPSS, STATISTICA, MATLAB and R
P. 274
6.5 Feature Selection 255
comfortably high: n/d = 25. One can therefore be confident that this classifier
performs in a nearly optimal way.
Example 6.13
Q: Redo the previous Example 6.12 for a three-class classifier, using dynamic
search.
A: Figure 6.22 shows the listing produced by SPSS in a dynamic search performed
on the cork-stopper data (three classes), using the squared Bhattacharyya distance
(D squared ) of the two closest classes as a merit criterion. Furthermore, features
were only entered or removed from the selected set if they contributed significantly
to the ANOVA F. The solution corresponding to Figure 6.22 used a 5% level for
the statistical significance of a candidate feature to enter the model, and a 10%
level to remove it. Notice that PRT, which had entered at step 1, was later
removed, at step 5. The nested solution {PRM, N, ARTG, RAAR} would not have
been found by a direct forward search.
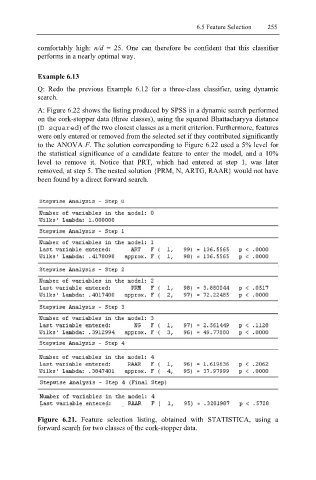
Figure 6.21. Feature selection listing, obtained with STATISTICA, using a
forward search for two classes of the cork-stopper data.