
Page 138 - Artificial Intelligence for Computational Modeling of the Heart
P. 138
110 Chapter 3 Learning cardiac anatomy
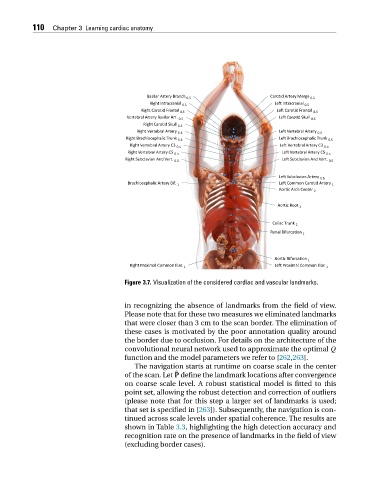
Figure 3.7. Visualization of the considered cardiac and vascular landmarks.
in recognizing the absence of landmarks from the field of view.
Please note that for these two measures we eliminated landmarks
that were closer than 3 cm to the scan border. The elimination of
these cases is motivated by the poor annotation quality around
the border due to occlusion. For details on the architecture of the
convolutional neural network used to approximate the optimal Q
function and the model parameters we refer to [262,263].
The navigation starts at runtime on coarse scale in the center
˜
of the scan. Let P define the landmark locations after convergence
on coarse scale level. A robust statistical model is fitted to this
point set, allowing the robust detection and correction of outliers
(please note that for this step a larger set of landmarks is used;
that set is specified in [263]). Subsequently, the navigation is con-
tinued across scale levels under spatial coherence. The results are
shown in Table 3.3, highlighting the high detection accuracy and
recognition rate on the presence of landmarks in the field of view
(excluding border cases).