
Page 137 - Artificial Intelligence for Computational Modeling of the Heart
P. 137
Chapter 3 Learning cardiac anatomy 109
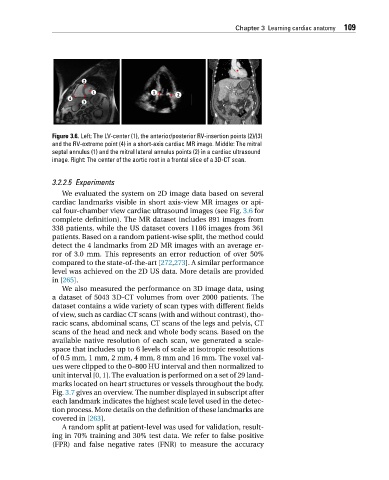
Figure 3.6. Left: The LV-center (1), the anterior/posterior RV-insertion points (2)/(3)
and the RV-extreme point (4) in a short-axis cardiac MR image. Middle: The mitral
septal annulus (1) and the mitral lateral annulus points (2) in a cardiac ultrasound
image. Right: The center of the aortic root in a frontal slice of a 3D-CT scan.
3.2.2.5 Experiments
We evaluated the system on 2D image data based on several
cardiac landmarks visible in short axis-view MR images or api-
cal four-chamber view cardiac ultrasound images (see Fig. 3.6 for
complete definition). The MR dataset includes 891 images from
338 patients, while the US dataset covers 1186 images from 361
patients. Based on a random patient-wise split, the method could
detect the 4 landmarks from 2D MR images with an average er-
ror of 3.0 mm. This represents an error reduction of over 50%
compared to the state-of-the-art [272,273]. A similar performance
level was achieved on the 2D US data. More details are provided
in [265].
We also measured the performance on 3D image data, using
a dataset of 5043 3D-CT volumes from over 2000 patients. The
dataset contains a wide variety of scan types with different fields
of view, such as cardiac CT scans (with and without contrast), tho-
racic scans, abdominal scans, CT scans of the legs and pelvis, CT
scans of the head and neck and whole body scans. Based on the
available native resolution of each scan, we generated a scale-
space that includes up to 6 levels of scale at isotropic resolutions
of 0.5 mm, 1 mm, 2 mm, 4 mm, 8 mm and 16 mm. The voxel val-
ues were clipped to the 0–800 HU interval and then normalized to
unit interval [0,1]. The evaluation is performed on a set of 29 land-
marks located on heart structures or vessels throughout the body.
Fig. 3.7 gives an overview. The number displayed in subscript after
each landmark indicates the highest scale level used in the detec-
tion process. More details on the definition of these landmarks are
covered in [263].
A random split at patient-level was used for validation, result-
ing in 70% training and 30% test data. We refer to false positive
(FPR) and false negative rates (FNR) to measure the accuracy