
Page 132 - Artificial Intelligence for Computational Modeling of the Heart
P. 132
104 Chapter 3 Learning cardiac anatomy
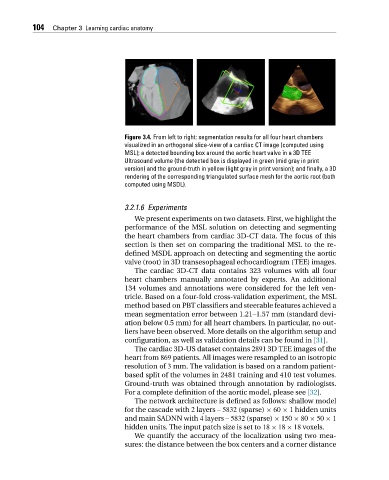
Figure 3.4. From left to right: segmentation results for all four heart chambers
visualized in an orthogonal slice-view of a cardiac CT image (computed using
MSL); a detected bounding box around the aortic heart valve in a 3D TEE
Ultrasound volume (the detected box is displayed in green (mid gray in print
version) and the ground-truth in yellow (light gray in print version); and finally, a 3D
rendering of the corresponding triangulated surface mesh for the aortic root (both
computed using MSDL).
3.2.1.6 Experiments
We present experiments on two datasets. First, we highlight the
performance of the MSL solution on detecting and segmenting
the heart chambers from cardiac 3D-CT data. The focus of this
section is then set on comparing the traditional MSL to the re-
defined MSDL approach on detecting and segmenting the aortic
valve (root) in 3D transesophageal echocardiogram (TEE) images.
The cardiac 3D-CT data contains 323 volumes with all four
heart chambers manually annotated by experts. An additional
134 volumes and annotations were considered for the left ven-
tricle. Based on a four-fold cross-validation experiment, the MSL
method based on PBT classifiers and steerable features achieved a
mean segmentation error between 1.21–1.57 mm (standard devi-
ation below 0.5 mm) for all heart chambers. In particular, no out-
liers have been observed. More details on the algorithm setup and
configuration, as well as validation details can be found in [31].
The cardiac 3D-US dataset contains 2891 3D TEE images of the
heart from 869 patients. All images were resampled to an isotropic
resolution of 3 mm. The validation is based on a random patient-
based split of the volumes in 2481 training and 410 test volumes.
Ground-truth was obtained through annotation by radiologists.
For a complete definition of the aortic model, please see [32].
The network architecture is defined as follows: shallow model
for the cascade with 2 layers – 5832 (sparse) × 60 × 1 hidden units
and main SADNN with 4 layers – 5832 (sparse) × 150 × 80 × 50 × 1
hidden units. The input patch size is set to 18 × 18 × 18 voxels.
We quantify the accuracy of the localization using two mea-
sures: the distance between the box centers and a corner distance