
Page 159 - Artificial Intelligence for Computational Modeling of the Heart
P. 159
Chapter 4 Data-driven reduction of cardiac models 131
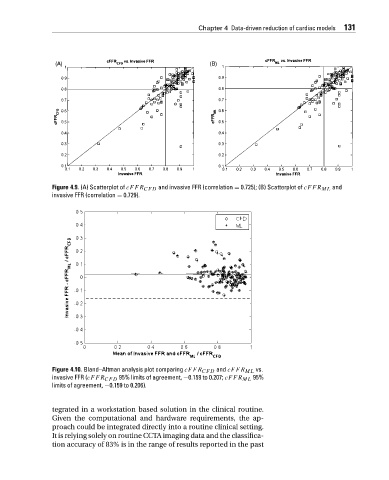
Figure 4.9. (A) Scatterplot of cFFR CFD and invasive FFR (correlation = 0.725); (B) Scatterplot of cFFR ML and
invasive FFR (correlation = 0.729).
Figure 4.10. Bland–Altman analysis plot comparing cFFR CFD and cFFR ML vs.
invasive FFR (cFFR CFD 95% limits of agreement, −0.159 to 0.207; cFFR ML 95%
limits of agreement, −0.159 to 0.206).
tegrated in a workstation based solution in the clinical routine.
Given the computational and hardware requirements, the ap-
proach could be integrated directly into a routine clinical setting.
It is relying solely on routine CCTA imaging data and the classifica-
tion accuracy of 83% is in the range of results reported in the past