
Page 155 - Artificial Intelligence for Computational Modeling of the Heart
P. 155
Chapter 4 Data-driven reduction of cardiac models 127
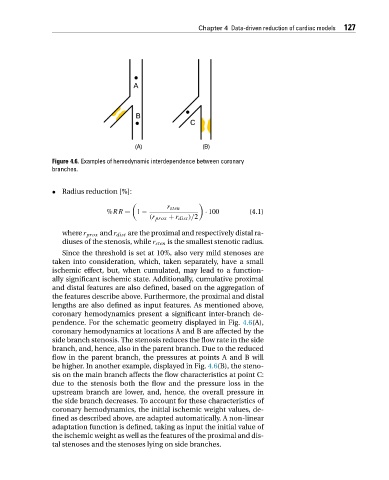
Figure 4.6. Examples of hemodynamic interdependence between coronary
branches.
• Radius reduction [%]:
r sten
%RR = 1 − · 100 (4.1)
(r prox + r dist )/2
where r prox and r dist are the proximal and respectively distal ra-
diuses of the stenosis, while r sten is the smallest stenotic radius.
Since the threshold is set at 10%, also very mild stenoses are
taken into consideration, which, taken separately, have a small
ischemic effect, but, when cumulated, may lead to a function-
ally significant ischemic state. Additionally, cumulative proximal
and distal features are also defined, based on the aggregation of
the features describe above. Furthermore, the proximal and distal
lengths are also defined as input features. As mentioned above,
coronary hemodynamics present a significant inter-branch de-
pendence. For the schematic geometry displayed in Fig. 4.6(A),
coronary hemodynamics at locations A and B are affected by the
side branch stenosis. The stenosis reduces the flow rate in the side
branch, and, hence, also in the parent branch. Due to the reduced
flow in the parent branch, the pressures at points A and B will
be higher. In another example, displayed in Fig. 4.6(B), the steno-
sis on the main branch affects the flow characteristics at point C:
due to the stenosis both the flow and the pressure loss in the
upstream branch are lower, and, hence, the overall pressure in
the side branch decreases. To account for these characteristics of
coronary hemodynamics, the initial ischemic weight values, de-
fined as described above, are adapted automatically. A non-linear
adaptation function is defined, taking as input the initial value of
the ischemic weight as well as the features of the proximal and dis-
tal stenoses and the stenoses lying on side branches.