
Page 157 - Artificial Intelligence for Computational Modeling of the Heart
P. 157
Chapter 4 Data-driven reduction of cardiac models 129
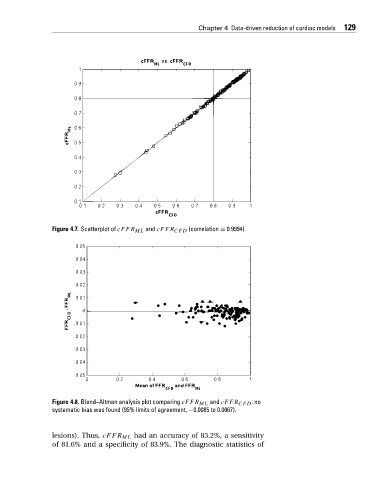
Figure 4.7. Scatterplot of cFFR ML and cFFR CFD (correlation = 0.9994).
Figure 4.8. Bland–Altman analysis plot comparing cFFR ML and cFFR CFD :no
systematic bias was found (95% limits of agreement, −0.0085 to 0.0067).
lesions). Thus, cFFR ML had an accuracy of 83.2%, a sensitivity
of 81.6% and a specificity of 83.9%. The diagnostic statistics of