Page 158 - Artificial Intelligence for Computational Modeling of the Heart
P. 158

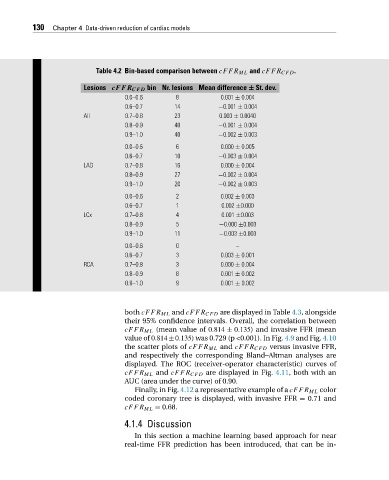
130  Chapter 4 Data-driven reduction of cardiac models


                                 Table 4.2 Bin-based comparison between cFFR ML and cFFR CFD .

                              Lesions cFFR CFD bin Nr. lesions Mean difference ± St. dev.
                                         0.0–0.6        8           0.001 ± 0.004
                                         0.6–0.7       14          −0.001 ± 0.004
                              All        0.7–0.8       23           0.000 ± 0.0040
                                         0.8–0.9       40          −0.001 ± 0.004
                                         0.9–1.0       40          −0.002 ± 0.003
                                         0.0–0.6        6           0.000 ± 0.005
                                         0.6–0.7       10          −0.003 ± 0.004
                              LAD        0.7–0.8       16           0.000 ± 0.004
                                         0.8–0.9       27          −0.002 ± 0.004
                                         0.9–1.0       20          −0.002 ± 0.003
                                         0.0–0.6        2           0.002 ± 0.003
                                         0.6–0.7        1           0.002 ±0.000
                              LCx        0.7–0.8        4           0.001 ±0.003
                                         0.8–0.9        5          −0.000 ±0.003
                                         0.9–1.0       11          −0.003 ±0.003
                                         0.0–0.6        0               –
                                         0.6–0.7        3           0.003 ± 0.001
                              RCA        0.7–0.8        3           0.000 ± 0.004
                                         0.8–0.9        8           0.001 ± 0.002
                                         0.9–1.0        9           0.001 ± 0.002


                                         both cFFR ML and cFFR CFD are displayed in Table 4.3, alongside
                                         their 95% confidence intervals. Overall, the correlation between
                                         cFFR ML (mean value of 0.814 ± 0.135) and invasive FFR (mean
                                         value of 0.814±0.135) was 0.729 (p <0.001). In Fig. 4.9 and Fig. 4.10
                                         the scatter plots of cFFR ML and cFFR CFD versus invasive FFR,
                                         and respectively the corresponding Bland–Altman analyses are
                                         displayed. The ROC (receiver-operator characteristic) curves of
                                         cFFR ML and cFFR CFD are displayed in Fig. 4.11, both with an
                                         AUC (area under the curve) of 0.90.
                                            Finally, in Fig. 4.12 a representative example of a cFFR ML color
                                         coded coronary tree is displayed, with invasive FFR = 0.71 and
                                         cFFR ML = 0.68.

                                         4.1.4 Discussion
                                            In this section a machine learning based approach for near
                                         real-time FFR prediction has been introduced, that can be in-
   153   154   155   156   157   158   159   160   161   162   163