
Page 185 - Artificial Intelligence for Computational Modeling of the Heart
P. 185
Chapter 4 Data-driven reduction of cardiac models 157
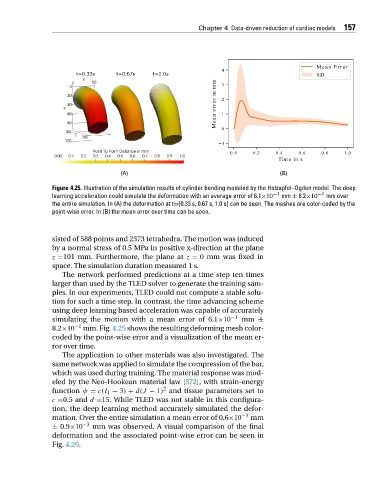
Figure 4.25. Illustration of the simulation results of cylinder bending modeled by the Holzapfel–Ogden model. The deep
learning acceleration could simulate the deformation with an average error of 6.1×10 −1 mm ± 8.2×10 −1 mm over
the entire simulation. In (A) the deformation at t=[0.33 s, 0.67 s, 1.0 s] can be seen. The meshes are color-coded by the
point-wise error. In (B) the mean error over time can be seen.
sisted of 588 points and 2373 tetrahedra. The motion was induced
by a normal stress of 0.5 MPa in positive x-direction at the plane
z =101 mm. Furthermore, the plane at z = 0 mm was fixed in
space. The simulation duration measured 1 s.
The network performed predictions at a time step ten times
larger than used by the TLED solver to generate the training sam-
ples. In our experiments, TLED could not compute a stable solu-
tion for such a time step. In contrast, the time advancing scheme
using deep learning based acceleration was capable of accurately
simulating the motion with a mean error of 6.1×10 −1 mm ±
8.2×10 −1 mm. Fig. 4.25 shows the resulting deforming mesh color-
coded by the point-wise error and a visualization of the mean er-
ror over time.
The application to other materials was also investigated. The
same network was applied to simulate the compression of the bar,
which was used during training. The material response was mod-
eled by the Neo-Hookean material law [372], with strain-energy
2
function ψ = c(I 1 − 3) + d(J − 1) and tissue parameters set to
c =0.5 and d =15. While TLED was not stable in this configura-
tion, the deep learning method accurately simulated the defor-
mation. Over the entire simulation a mean error of 0.6×10 −3 mm
± 0.9×10 −3 mm was observed. A visual comparison of the final
deformation and the associated point-wise error can be seen in
Fig. 4.26.