
Page 226 - Artificial Intelligence for Computational Modeling of the Heart
P. 226
Chapter 6 Additional clinical applications 199
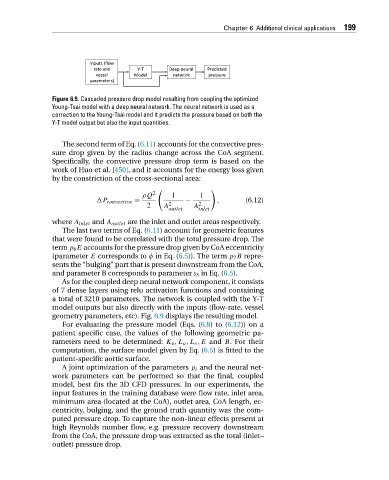
Figure 6.9. Cascaded pressure drop model resulting from coupling the optimized
Young-Tsai model with a deep neural network. The neural network is used as a
correction to the Young-Tsai model and it predicts the pressure based on both the
Y-T model output but also the input quantities.
The second term of Eq. (6.11) accounts for the convective pres-
sure drop given by the radius change across the CoA segment.
Specifically, the convective pressure drop term is based on the
work of Huo et al. [450], and it accounts for the energy loss given
by the constriction of the cross-sectional area:
2
ρQ 1 1
P convective = − , (6.12)
2 A 2 A 2
outlet inlet
where A inlet and A outlet are the inlet and outlet areas respectively.
The last two terms of Eq. (6.11) account for geometric features
that were found to be correlated with the total pressure drop. The
term p 6 E accounts for the pressure drop given by CoA eccentricity
(parameter E corresponds to φ in Eq. (6.5)). The term p 7 B repre-
sents the “bulging” part that is present downstream from the CoA,
and parameter B corresponds to parameter s 5 in Eq. (6.5).
As for the coupled deep neural network component, it consists
of 7 dense layers using relu activation functions and containing
a total of 3210 parameters. The network is coupled with the Y-T
model outputs but also directly with the inputs (flow-rate, vessel
geometry parameters, etc). Fig. 6.9 displays the resulting model.
For evaluating the pressure model (Eqs. (6.8)to(6.12)) on a
patient specific case, the values of the following geometric pa-
rameters need to be determined: K v ,L a ,L s ,E and B.For their
computation, the surface model given by Eq. (6.5) is fitted to the
patient-specific aortic surface.
A joint optimization of the parameters p i and the neural net-
work parameters can be performed so that the final, coupled
model, best fits the 3D CFD pressures. In our experiments, the
input features in the training database were flow rate, inlet area,
minimum area (located at the CoA), outlet area, CoA length, ec-
centricity, bulging, and the ground truth quantity was the com-
puted pressure drop. To capture the non-linear effects present at
high Reynolds number flow, e.g. pressure recovery downstream
from the CoA, the pressure drop was extracted as the total (inlet–
outlet) pressure drop.