
Page 228 - Artificial Intelligence for Computational Modeling of the Heart
P. 228
Chapter 6 Additional clinical applications 201
Table 6.3 Pressure drop model parameters as they appear in Eqs. (6.8)–(6.11): p 1 , p 2 and p 3 are
related to the viscous pressure loss, p 4 , p 5 , p 6 and p 7 are related to the effects of turbulence,
convection, eccentricity and respectively bulging on the pressure loss.
p 1 p 2 p 3 p 4 p 5 p 6 p 7
Original Y-T model 0.83 3.28 16.0 0.9 – – –
Optimized model 0.114 8.776 19.743 0.980 1.485 0.327 0.119
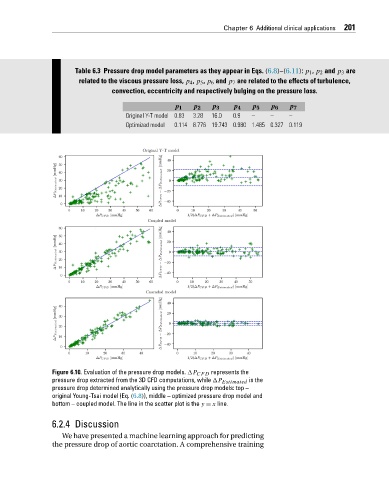
Figure 6.10. Evaluation of the pressure drop models. P CFD represents the
pressure drop extracted from the 3D CFD computations, while P Estimated is the
pressure drop determined analytically using the pressure drop models: top –
original Young-Tsai model (Eq. (6.8)), middle – optimized pressure drop model and
bottom – coupled model. The line in the scatter plot is the y = x line.
6.2.4 Discussion
We have presented a machine learning approach for predicting
the pressure drop of aortic coarctation. A comprehensive training