
Page 45 - Artificial Intelligence for Computational Modeling of the Heart
P. 45
Chapter 1 Multi-scale models of the heart for patient-specific simulations 15
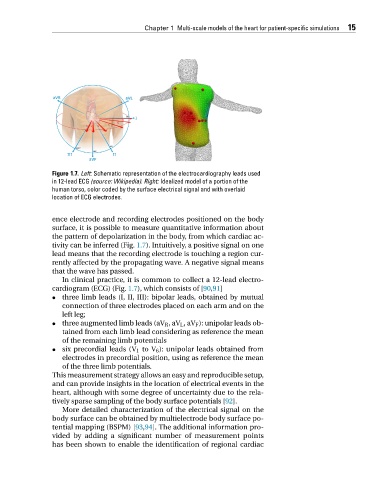
Figure 1.7. Left: Schematic representation of the electrocardiography leads used
in 12-lead ECG (source: Wikipedia). Right: Idealized model of a portion of the
human torso, color coded by the surface electrical signal and with overlaid
location of ECG electrodes.
ence electrode and recording electrodes positioned on the body
surface, it is possible to measure quantitative information about
the pattern of depolarization in the body, from which cardiac ac-
tivity can be inferred (Fig. 1.7). Intuitively, a positive signal on one
lead means that the recording electrode is touching a region cur-
rently affected by the propagating wave. A negative signal means
that the wave has passed.
In clinical practice, it is common to collect a 12-lead electro-
cardiogram (ECG) (Fig. 1.7), which consists of [90,91]
• three limb leads (I, II, III): bipolar leads, obtained by mutual
connection of three electrodes placed on each arm and on the
left leg;
• three augmented limb leads (aV R ,aV L ,aV F ): unipolar leads ob-
tained from each limb lead considering as reference the mean
of the remaining limb potentials
• six precordial leads (V 1 to V 6 ): unipolar leads obtained from
electrodes in precordial position, using as reference the mean
of the three limb potentials.
This measurement strategy allows an easy and reproducible setup,
and can provide insights in the location of electrical events in the
heart, although with some degree of uncertainty due to the rela-
tively sparse sampling of the body surface potentials [92].
More detailed characterization of the electrical signal on the
body surface can be obtained by multielectrode body surface po-
tential mapping (BSPM) [93,94]. The additional information pro-
vided by adding a significant number of measurement points
has been shown to enable the identification of regional cardiac