
Page 161 - Artificial Intelligence in the Age of Neural Networks and Brain Computing
P. 161
150 CHAPTER 7 Pitfalls and Opportunities in the Development of AI Systems
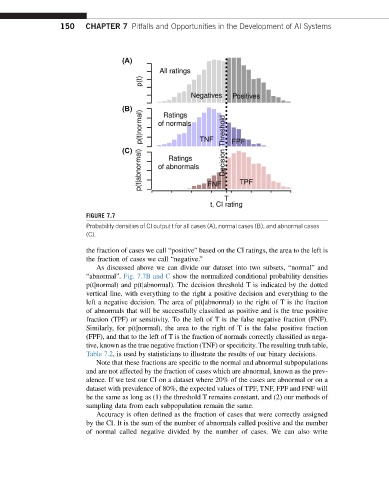
FIGURE 7.7
Probability densities of CI output t for all cases (A), normal cases (B), and abnormal cases
(C).
the fraction of cases we call “positive” based on the CI ratings, the area to the left is
the fraction of cases we call “negative.”
As discussed above we can divide our dataset into two subsets, “normal” and
“abnormal”. Fig. 7.7B and C show the normalized conditional probability densities
p(tjnormal) and p(tjabnormal). The decision threshold T is indicated by the dotted
vertical line, with everything to the right a positive decision and everything to the
left a negative decision. The area of p(tjabnormal) to the right of T is the fraction
of abnormals that will be successfully classified as positive and is the true positive
fraction (TPF) or sensitivity. To the left of T is the false negative fraction (FNF).
Similarly, for p(tjnormal), the area to the right of T is the false positive fraction
(FPF), and that to the left of T is the fraction of normals correctly classified as nega-
tive, known as the true negative fraction (TNF) or specificity. The resulting truth table,
Table 7.2, is used by statisticians to illustrate the results of our binary decisions.
Note that these fractions are specific to the normal and abnormal subpopulations
and are not affected by the fraction of cases which are abnormal, known as the prev-
alence. If we test our CI on a dataset where 20% of the cases are abnormal or on a
dataset with prevalence of 80%, the expected values of TPF, TNF, FPF and FNF will
be the same as long as (1) the threshold T remains constant, and (2) our methods of
sampling data from each subpopulation remain the same.
Accuracy is often defined as the fraction of cases that were correctly assigned
by the CI. It is the sum of the number of abnormals called positive and the number
of normal called negative divided by the number of cases. We can also write