
Page 164 - Artificial Intelligence in the Age of Neural Networks and Brain Computing
P. 164
3. AI Evaluation 153
particular threshold. These measures are the receiver operating characteristic (ROC)
curve and the area under that curve (AUC) as explained below.
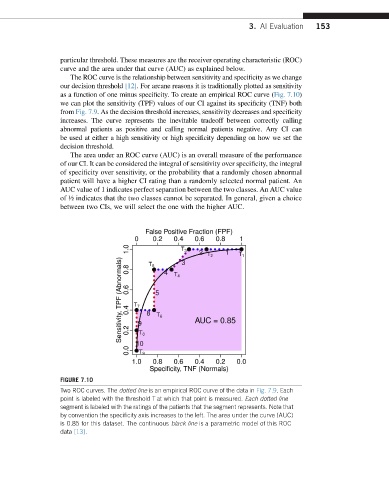
The ROC curve is the relationship between sensitivity and specificity as we change
our decision threshold [12]. For arcane reasons it is traditionally plotted as sensitivity
as a function of one minus specificity. To create an empirical ROC curve (Fig. 7.10)
we can plot the sensitivity (TPF) values of our CI against its specificity (TNF) both
from Fig. 7.9. As the decision threshold increases, sensitivity decreases and specificity
increases. The curve represents the inevitable tradeoff between correctly calling
abnormal patients as positive and calling normal patients negative. Any CI can
be used at either a high sensitivity or high specificity depending on how we set the
decision threshold.
The area under an ROC curve (AUC) is an overall measure of the performance
of our CI. It can be considered the integral of sensitivity over specificity, the integral
of specificity over sensitivity, or the probability that a randomly chosen abnormal
patient will have a higher CI rating than a randomly selected normal patient. An
AUC value of 1 indicates perfect separation between the two classes. An AUC value
of ½ indicates that the two classes cannot be separated. In general, given a choice
between two CIs, we will select the one with the higher AUC.
FIGURE 7.10
Two ROC curves. The dotted line is an empirical ROC curve of the data in Fig. 7.9. Each
point is labeled with the threshold T at which that point is measured. Each dotted line
segment is labeled with the ratings of the patients that the segment represents. Note that
by convention the specificity axis increases to the left. The area under the curve (AUC)
is 0.85 for this dataset. The continuous black line is a parametric model of this ROC
data [13].