
Page 163 - Artificial Intelligence in the Age of Neural Networks and Brain Computing
P. 163
152 CHAPTER 7 Pitfalls and Opportunities in the Development of AI Systems
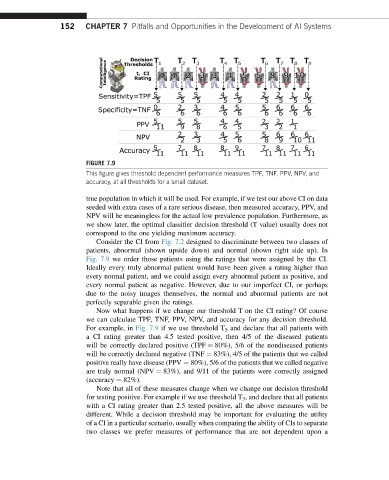
FIGURE 7.9
This figure gives threshold dependent performance measures TPF, TNF, PPV, NPV, and
accuracy, at all thresholds for a small dataset.
true population in which it will be used. For example, if we test our above CI on data
seeded with extra cases of a rare serious disease, then measured accuracy, PPV, and
NPV will be meaningless for the actual low prevalence population. Furthermore, as
we show later, the optimal classifier decision threshold (T value) usually does not
correspond to the one yielding maximum accuracy.
Consider the CI from Fig. 7.2 designed to discriminate between two classes of
patients, abnormal (shown upside down) and normal (shown right side up). In
Fig. 7.9 we order those patients using the ratings that were assigned by the CI.
Ideally every truly abnormal patient would have been given a rating higher than
every normal patient, and we could assign every abnormal patient as positive, and
every normal patient as negative. However, due to our imperfect CI, or perhaps
due to the noisy images themselves, the normal and abnormal patients are not
perfectly separable given the ratings.
Now what happens if we change our threshold T on the CI rating? Of course
we can calculate TPF, TNF, PPV, NPV, and accuracy for any decision threshold.
For example, in Fig. 7.9 if we use threshold T 5 and declare that all patients with
a CI rating greater than 4.5 tested positive, then 4/5 of the diseased patients
will be correctly declared positive (TPF ¼ 80%), 5/6 of the nondiseased patients
will be correctly declared negative (TNF ¼ 83%), 4/5 of the patients that we called
positive really have disease (PPV ¼ 80%), 5/6 of the patients that we called negative
are truly normal (NPV ¼ 83%), and 9/11 of the patients were correctly assigned
(accuracy ¼ 82%).
Note that all of these measures change when we change our decision threshold
for testing positive. For example if we use threshold T 3 , and declare that all patients
with a CI rating greater than 2.5 tested positive, all the above measures will be
different. While a decision threshold may be important for evaluating the utility
of a CI in a particular scenario, usually when comparing the ability of CIs to separate
two classes we prefer measures of performance that are not dependent upon a