
Page 162 - Artificial Intelligence in the Age of Neural Networks and Brain Computing
P. 162
3. AI Evaluation 151
Table 7.2 Truth Table for a Particular Decision Threshold T
Truth Table Abnormal Normal Sum
Result Positive TPF ¼ Sensitivity FPF ¼ 1-Specificity 1 þ (Sens-Spec)
We found it! We worry wrongly!
(type I error)
Result Negative FNF ¼ 1-Sensitivity TNF ¼ Specificity 1 (Sens-Spec)
We missed it! We ruled it out!
(type II error)
Sum 1 1 2
this fraction in the terms presented above: Accuracy ¼ Prevalence TPF þ
(1 Prevalence) TNF.
Two less common measures, the positive predictive value (PPV), the fraction of all
positive results that are true positives, and the negative predictive value (NPV), the
fraction of negative results that are true negatives, are also prevalence dependent.
These are helpful for their explanatory value of the real significance of test results.
For example, for serious diseases with very low prevalence, positive CI results can
cause needless worry. Even for a very sensitive CI, say sensitivity 0.99, and quite
good specificity 0.90, given a low prevalence of disease 0.01 for the general popula-
tion, fewer than 10% (PPV) of those told they tested positive are actually positive, and
the great majority are needlessly distraught.
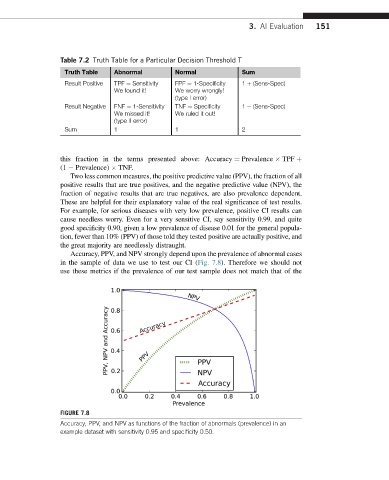
Accuracy, PPV, and NPV strongly depend upon the prevalence of abnormal cases
in the sample of data we use to test our CI (Fig. 7.8). Therefore we should not
use these metrics if the prevalence of our test sample does not match that of the
FIGURE 7.8
Accuracy, PPV, and NPV as functions of the fraction of abnormals (prevalence) in an
example dataset with sensitivity 0.95 and specificity 0.50.