
Page 167 - Artificial Intelligence in the Age of Neural Networks and Brain Computing
P. 167
156 CHAPTER 7 Pitfalls and Opportunities in the Development of AI Systems
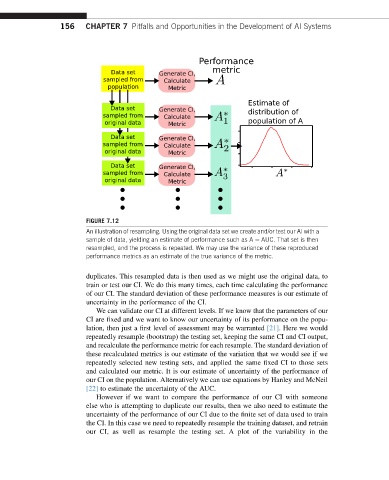
FIGURE 7.12
An illustration of resampling. Using the original data set we create and/or test our AI with a
sample of data, yielding an estimate of performance such as A ¼ AUC. That set is then
resampled, and the process is repeated. We may use the variance of these reproduced
performance metrics as an estimate of the true variance of the metric.
duplicates. This resampled data is then used as we might use the original data, to
train or test our CI. We do this many times, each time calculating the performance
of our CI. The standard deviation of these performance measures is our estimate of
uncertainty in the performance of the CI.
We can validate our CI at different levels. If we know that the parameters of our
CI are fixed and we want to know our uncertainty of its performance on the popu-
lation, then just a first level of assessment may be warranted [21]. Here we would
repeatedly resample (bootstrap) the testing set, keeping the same CI and CI output,
and recalculate the performance metric for each resample. The standard deviation of
these recalculated metrics is our estimate of the variation that we would see if we
repeatedly selected new testing sets, and applied the same fixed CI to those sets
and calculated our metric. It is our estimate of uncertainty of the performance of
our CI on the population. Alternatively we can use equations by Hanley and McNeil
[22] to estimate the uncertainty of the AUC.
Howeverifwe wantto compare the performance of ourCIwith someone
else whoisattemptingtoduplicateour results,thenwealsoneedtoestimatethe
uncertainty of the performance of our CI due to the finite set of data used to train
the CI. In this case we need to repeatedly resample the training dataset, and retrain
our CI, as well as resample the testing set. A plot of the variability in the