
Page 166 - Artificial Intelligence in the Age of Neural Networks and Brain Computing
P. 166
4. Variability and Bias in Our Performance Estimates 155
Specificity (TNF)
1.0 0.8 0.6 0.4 0.2 0.0
1.0 1 0
4 5 6 3 2
● ●
0.8 0.6 ● ● 0 0 8 7
● ●
3 3
9
Sensitivity (TPF) 0.4 ●●●● ● ● ● Biopsy patient?
1 ●
●
● ●
1 4
4
6 6
2 ● 2 ●
7 7
5 8 5 8
X Biopsy patient?
9 9
0.2 ● ● X Any immediate
work up?
X = Reader Number
0.0
0.0 0.2 0.4 0.6 0.8 1.0
False Positive Fraction (FPF)
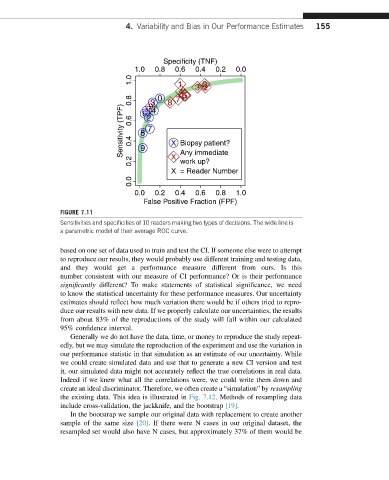
FIGURE 7.11
Sensitivities and specificities of 10 readers making two types of decisions. The wide line is
a parametric model of their average ROC curve.
based on one set of data used to train and test the CI. If someone else were to attempt
to reproduce our results, they would probably use different training and testing data,
and they would get a performance measure different from ours. Is this
number consistent with our measure of CI performance? Or is their performance
significantly different? To make statements of statistical significance, we need
to know the statistical uncertainty for these performance measures. Our uncertainty
estimates should reflect how much variation there would be if others tried to repro-
duce our results with new data. If we properly calculate our uncertainties, the results
from about 83% of the reproductions of the study will fall within our calculated
95% confidence interval.
Generally we do not have the data, time, or money to reproduce the study repeat-
edly, but we may simulate the reproduction of the experiment and use the variation in
our performance statistic in that simulation as an estimate of our uncertainty. While
we could create simulated data and use that to generate a new CI version and test
it, our simulated data might not accurately reflect the true correlations in real data.
Indeed if we knew what all the correlations were, we could write them down and
create an ideal discriminator. Therefore, we often create a “simulation” by resampling
the existing data. This idea is illustrated in Fig. 7.12. Methods of resampling data
include cross-validation, the jackknife, and the bootstrap [19].
In the bootstrap we sample our original data with replacement to create another
sample of the same size [20]. If there were N cases in our original dataset, the
resampled set would also have N cases, but approximately 37% of them would be