
Page 102 - Autonomous Mobile Robots
P. 102
Millimeter Wave RADAR Power-Range Spectra Interpretation 85
50
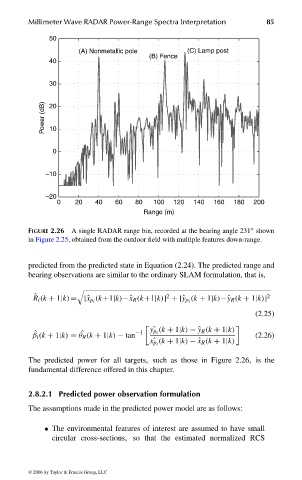
(A) Nonmetallic pole (C) Lamp post
(B) Fence
40
30
Power (dB) 20
10
0
–10
–20
0 20 40 60 80 100 120 140 160 180 200
Range (m)
◦
FIGURE 2.26 A single RADAR range bin, recorded at the bearing angle 231 shown
in Figure 2.25, obtained from the outdoor field with multiple features down-range.
predicted from the predicted state in Equation (2.24). The predicted range and
bearing observations are similar to the ordinary SLAM formulation, that is,
ˆ 2 2
R i (k + 1|k)= [ˆx p i (k+1|k)−ˆx R (k+1|k)] +[ˆy p i (k + 1|k)−ˆy R (k + 1|k)]
(2.25)
(k + 1|k) −ˆy R (k + 1|k)
ˆ β i (k + 1|k) = ˆ θ R (k + 1|k) − tan −1 ˆ y p i (2.26)
(k + 1|k) −ˆx R (k + 1|k)
ˆ x p i
The predicted power for all targets, such as those in Figure 2.26, is the
fundamental difference offered in this chapter.
2.8.2.1 Predicted power observation formulation
The assumptions made in the predicted power model are as follows:
• The environmental features of interest are assumed to have small
circular cross-sections, so that the estimated normalized RCS
© 2006 by Taylor & Francis Group, LLC
FRANKL: “dk6033_c002” — 2006/3/31 — 17:29 — page 85 — #45