
Page 86 - Autonomous Mobile Robots
P. 86
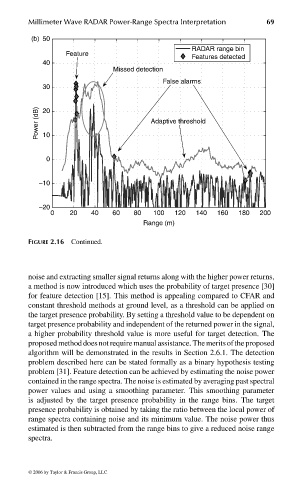
Millimeter Wave RADAR Power-Range Spectra Interpretation    69

                              (b)  50
                                                                       RADAR range bin
                                       Feature
                                                                       Features detected
                                 40
                                                   Missed detection
                                                                False alarms
                                 30

                                Power (dB)  20               Adaptive threshold


                                 10


                                  0


                                –10


                                –20
                                   0    20    40   60   80   100   120  140  160   180  200
                                                           Range (m)

                              FIGURE 2.16 Continued.


                              noise and extracting smaller signal returns along with the higher power returns,
                              a method is now introduced which uses the probability of target presence [30]
                              for feature detection [15]. This method is appealing compared to CFAR and
                              constant threshold methods at ground level, as a threshold can be applied on
                              the target presence probability. By setting a threshold value to be dependent on
                              target presence probability and independent of the returned power in the signal,
                              a higher probability threshold value is more useful for target detection. The
                              proposedmethoddoesnotrequiremanualassistance. Themeritsoftheproposed
                              algorithm will be demonstrated in the results in Section 2.6.1. The detection
                              problem described here can be stated formally as a binary hypothesis testing
                              problem [31]. Feature detection can be achieved by estimating the noise power
                              contained in the range spectra. The noise is estimated by averaging past spectral
                              power values and using a smoothing parameter. This smoothing parameter
                              is adjusted by the target presence probability in the range bins. The target
                              presence probability is obtained by taking the ratio between the local power of
                              range spectra containing noise and its minimum value. The noise power thus
                              estimated is then subtracted from the range bins to give a reduced noise range
                              spectra.


                              © 2006 by Taylor & Francis Group, LLC


                                 FRANKL: “dk6033_c002” — 2006/3/31 — 17:29 — page 69 — #29