
Page 91 - Autonomous Mobile Robots
P. 91
74 Autonomous Mobile Robots
(c) 70
60
50
40
Power (dB) 30
20
10
0
–10
0 20 40 60 80 100 120 140 160 180 200
Range (m)
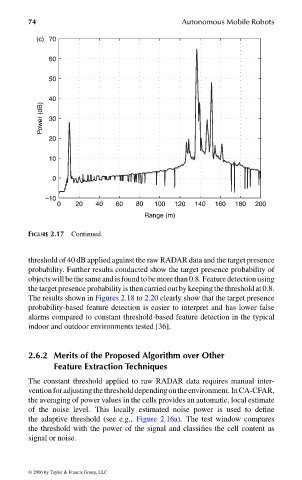
FIGURE 2.17 Continued.
threshold of 40 dB applied against the raw RADAR data and the target presence
probability. Further results conducted show the target presence probability of
objects will be the same and is found to be more than 0.8. Feature detection using
the target presence probability is then carried out by keeping the threshold at 0.8.
The results shown in Figures 2.18 to 2.20 clearly show that the target presence
probability-based feature detection is easier to interpret and has lower false
alarms compared to constant threshold-based feature detection in the typical
indoor and outdoor environments tested [36].
2.6.2 Merits of the Proposed Algorithm over Other
Feature Extraction Techniques
The constant threshold applied to raw RADAR data requires manual inter-
ventionforadjustingthethresholddependingontheenvironment. InCA-CFAR,
the averaging of power values in the cells provides an automatic, local estimate
of the noise level. This locally estimated noise power is used to define
the adaptive threshold (see e.g., Figure 2.16a). The test window compares
the threshold with the power of the signal and classifies the cell content as
signal or noise.
© 2006 by Taylor & Francis Group, LLC
FRANKL: “dk6033_c002” — 2006/3/31 — 17:29 — page 74 — #34