
Page 90 - Autonomous Mobile Robots
P. 90
Millimeter Wave RADAR Power-Range Spectra Interpretation 73
(a) 50
40
30
Power (dB) 20
10
0
–10
–20
0 20 40 60 80 100 120 140 160 180 200
Range (m)
(b)
1
0.8
Probability 0.6
0.4
0.2
0
0 20 40 60 80 100 120 140 160 180 200
Range (m)
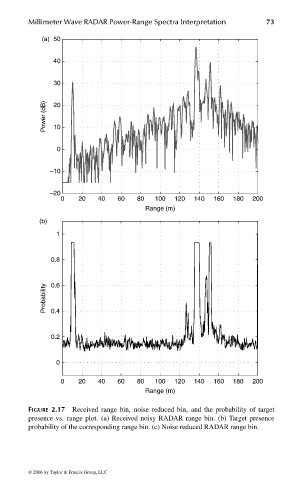
FIGURE 2.17 Received range bin, noise reduced bin, and the probability of target
presence vs. range plot. (a) Received noisy RADAR range bin. (b) Target presence
probability of the corresponding range bin. (c) Noise reduced RADAR range bin.
© 2006 by Taylor & Francis Group, LLC
FRANKL: “dk6033_c002” — 2006/3/31 — 17:29 — page 73 — #33