
Page 92 - Autonomous Mobile Robots
P. 92
Millimeter Wave RADAR Power-Range Spectra Interpretation 75
(a)
Power (dB) –30 30
50
0
–20 20
10
–10
Distance (m)
0 0
10 –10
Distance (m)
20 –20
30 –30
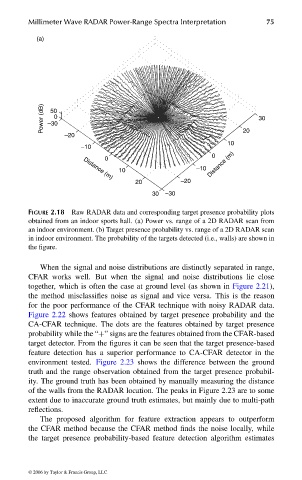
FIGURE 2.18 Raw RADAR data and corresponding target presence probability plots
obtained from an indoor sports hall. (a) Power vs. range of a 2D RADAR scan from
an indoor environment. (b) Target presence probability vs. range of a 2D RADAR scan
in indoor environment. The probability of the targets detected (i.e., walls) are shown in
the figure.
When the signal and noise distributions are distinctly separated in range,
CFAR works well. But when the signal and noise distributions lie close
together, which is often the case at ground level (as shown in Figure 2.21),
the method misclassifies noise as signal and vice versa. This is the reason
for the poor performance of the CFAR technique with noisy RADAR data.
Figure 2.22 shows features obtained by target presence probability and the
CA-CFAR technique. The dots are the features obtained by target presence
probability while the “+” signs are the features obtained from the CFAR-based
target detector. From the figures it can be seen that the target presence-based
feature detection has a superior performance to CA-CFAR detector in the
environment tested. Figure 2.23 shows the difference between the ground
truth and the range observation obtained from the target presence probabil-
ity. The ground truth has been obtained by manually measuring the distance
of the walls from the RADAR location. The peaks in Figure 2.23 are to some
extent due to inaccurate ground truth estimates, but mainly due to multi-path
reflections.
The proposed algorithm for feature extraction appears to outperform
the CFAR method because the CFAR method finds the noise locally, while
the target presence probability-based feature detection algorithm estimates
© 2006 by Taylor & Francis Group, LLC
FRANKL: “dk6033_c002” — 2006/3/31 — 17:29 — page 75 — #35