
Page 96 - Autonomous Mobile Robots
P. 96
Millimeter Wave RADAR Power-Range Spectra Interpretation 79
(a) Indoor stadium
Const. threshold
on raw data
20
Threshold on
probability data
15
10 5
Y distance (m) –5 0
–10
–15
–20
–25
–30 –20 –10 0 10 20 30
X distance (m)
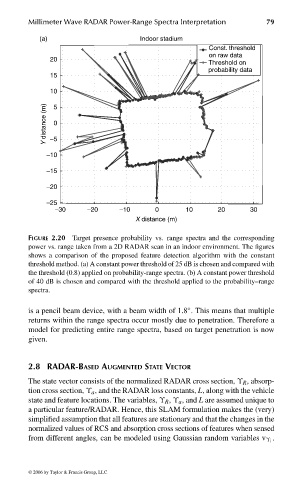
FIGURE 2.20 Target presence probability vs. range spectra and the corresponding
power vs. range taken from a 2D RADAR scan in an indoor environment. The figures
shows a comparison of the proposed feature detection algorithm with the constant
threshold method. (a) A constant power threshold of 25 dB is chosen and compared with
the threshold (0.8) applied on probability-range spectra. (b) A constant power threshold
of 40 dB is chosen and compared with the threshold applied to the probability–range
spectra.
is a pencil beam device, with a beam width of 1.8 . This means that multiple
◦
returns within the range spectra occur mostly due to penetration. Therefore a
model for predicting entire range spectra, based on target penetration is now
given.
2.8 RADAR-BASED AUGMENTED STATE VECTOR
The state vector consists of the normalized RADAR cross section, ϒ R , absorp-
tion cross section, ϒ a , and the RADAR loss constants, L, along with the vehicle
state and feature locations. The variables, ϒ R , ϒ a , and L are assumed unique to
a particular feature/RADAR. Hence, this SLAM formulation makes the (very)
simplified assumption that all features are stationary and that the changes in the
normalized values of RCS and absorption cross sections of features when sensed
.
from different angles, can be modeled using Gaussian random variables v ϒ i
© 2006 by Taylor & Francis Group, LLC
FRANKL: “dk6033_c002” — 2006/3/31 — 17:29 — page 79 — #39