
Page 176 - Basic Gas Chromatography
P. 176
Topics 163 GC by Analysis Chiral gv?" 18 = m/z SIM: Dioxide Caton AMU 10-200 TIC: Water fj | Phenol A ——~ Time (SIM). monitoring ion selected and (TIC) chromatogram ion of total Comparison 10.12. Fig. compares rapidly base data computer The peak. each identify to used be its in spectra reference 150,000 over with spectrum mass unknown each
Special CH,CH,t 29 40 (EI). the of the and (TIC—Total (SIM—Selected Fig. (see compounds. Daltons. All computer ] I 120
a. CHsCH2CH;t 43 75 mass spectrometer 100% as it peak, base 10.11). scan total a ions individual compound unknown 400 to 40 the from I ] 100 (EI). hexane
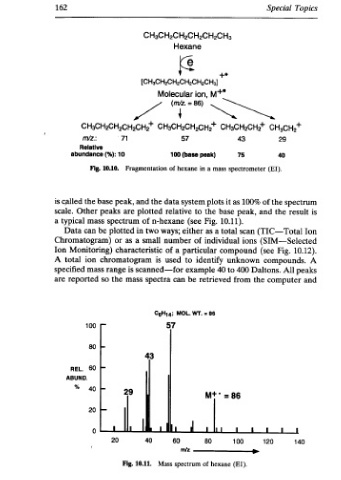
CHsCH2CH2CHsCHeCHs Hexane ke [CHsCH2CH2CH2CH2CHs] ion, Molecular = 86) me CHsCH2CH,CH,* 57 peak) (base 100 a in hexane of plots system data the relative the to Fig. (see n-hexane either ways; as of number particular a of identify to used is example scanned—for can spectra retrieved be CgHy4; 86 = WT. MOL. 57 Livi 80 60 FI of spectrum
+e
M+®
Z
CHgCH2CH,CH,CH;* ‘71 Relative 10 (%): Fragmentation 10.10. Fig. and peak, base the plotted are peaks mass of spectrum two in plotted be can as or small a characteristic Monitoring) chromatogram ion is range mass mass the so f- 100 43 F 60 99 40F 20 I 0 ] 20 40 10.11. Fig.
162 m2.: abundance called is Other scale. typical a Data Chromatogram) Ion total A specified reported are REL. ABUND. *