
Page 177 - Basic Gas Chromatography
P. 177
163 (SIM). compares its in latest acquisition is (typi- rate is data qualitative trace way a to exposed the obtained and selected trap synthesis, pesticides, of chiral- compounds resolution provides
monitoring rapidly spectra the with data sensitivity points). data ions of acquisition quantitative for for mode level. such in again from that to MS/MS), as called ion newer the in (drugs, significance chiral high GC
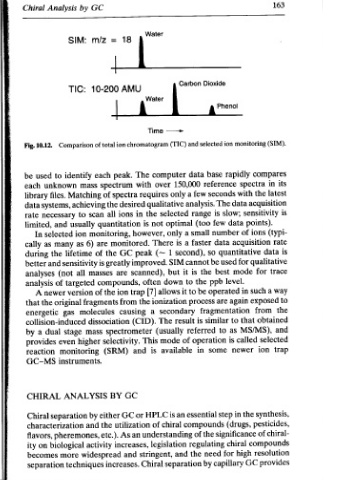
Dioxide Phenol A ion selected base reference seconds The slow; is few (too number data so used be best the ppb operated are fragmentation similar to is operation some step compounds of the regulating for need capillary by
Caton ——~ and (TIC) data 150,000 few a only analysis. range selected optimal small a only faster a is second), cannot SIM is it but the to down be to it process secondary is result referred of in available essential an the and separation
gv?" Water Time chromatogram computer The over with requires qualitative the not is however, There 1 (~ peak improved. scanned), often allows [7] ionization the a The (CID). (usually mode This is is HPLC chiral of understanding legislation stringent, Chiral
AMU fj desired in monitored. trap causing spectrometer and GC or utilization an increases, and
18 ion peak. spectra ions GC are ion from selectivity. GC As increases.
= | spectrum of the all quantitation monitoring, the greatly compounds, the dissociation (SRM) BY either the etc.).
GC m/z 10-200 of total each scan are of is masses of fragments molecules mass by and activity widespread
by SIM: TIC: Comparison identify mass Matching achieving to usually ion 6) as lifetime sensitivity all targeted version stage higher monitoring instruments. ANALYSIS pheremones, techniques
Analysis to unknown files. systems, necessary and selected many the and (not of newer original gas collision-induced dual even separation characterization biological more
Chiral 10.12. Fig. used be each library data rate limited, In as cally during better analyses analysis A the that energetic a by provides reaction GC-MS CHIRAL Chiral flavors, on ity becomes separation
Topics spectrum is result Ion 10.12). A peaks and i 140
Special CH,CH,t 29 40 (EI). the of the and (TIC—Total (SIM—Selected Fig. (see compounds. Daltons. All computer ] I 120
a. CHsCH2CH;t 43 75 mass spectrometer 100% as it plots peak, base 10.11). scan total a ions individual compound unknown 400 to 40 the from retrieved I ] 100 (EI). hexane
CHsCH2CH2CHsCHeCHs Hexane ke [CHsCH2CH2CH2CH2CHs] ion, Molecular = 86) me CHsCH2CH,CH,* 57 peak) (base 100 a in hexane of system data the relative the to Fig. (see n-hexane either ways; as of number particular a of identify to used is example scanned—for can spectra be CgHy4; 86 = WT. MOL. 57 Livi 80 60 FI of spectrum Mass
+e
M+®
Z
CHgCH2CH,CH,CH;* ‘71 Relative 10 (%): Fragmentation 10.10. Fig. and peak, base the plotted are peaks mass of spectrum two in plotted be as or small a characteristic Monitoring) chromatogram ion is range mass mass the so f- 100 43 F 60 99 40F 20 I 0 ] 20 40 10.11. Fig.
162 m2.: abundance called is Other scale. typical a can Data Chromatogram) Ion total A specified reported are REL. ABUND. *