Page 206 - Basics of MATLAB and Beyond
P. 206

% Reproduce the layers at the different heights:
                               faces = zeros((M-1)*N,4);
                               for i=1:M-1
                                 rows = (1:N) + (i - 1)*N;
                                 faces(rows,:) = facets + (i - 1)*N;
                               end

                               %Define heat source and temperature:
                               xs = -0.5;
                               ys=0;
                               zs = 0.25;
                               dist = sqrt((x - xs).^2 + (y - ys).^2 + (z - zs).^2);
                               T = 1./dist;

                               clf
                               colormap(hot)
                               h = patch(’vertices’,vert,’faces’,faces,...
                                   ’facevertexcdata’,T,...
                                   ’facecolor’,’interp’,...
                                   ’linestyle’,’none’);
                               view(78,36)
                               axis equal
                               % Plot the source:
                               hold on
                               plot3([xs xs],[ys ys],[0 zs])
                               plot3(xs,ys,zs,’*’,...
                                    ’markerSize’,12)


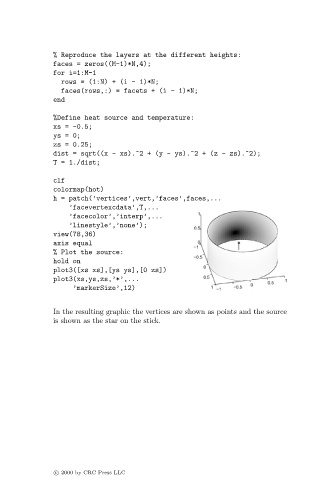
                               In the resulting graphic the vertices are shown as points and the source
                               is shown as the star on the stick.


                               c   2000 by CRC Press LLC
   201   202   203   204   205   206