
Page 201 - Basics of MATLAB and Beyond
P. 201
x = linspace(lims(1),lims(2));
y = feval(f,x);
clf
plot(x,y)
(This trick is used in the m-file fplot which is a more elaborate version
of our funplot. fplot adapts the plotting grid to the local behaviour
of the function, putting in more points where the gradient is steep.)
Exercise 11 (Page 86)
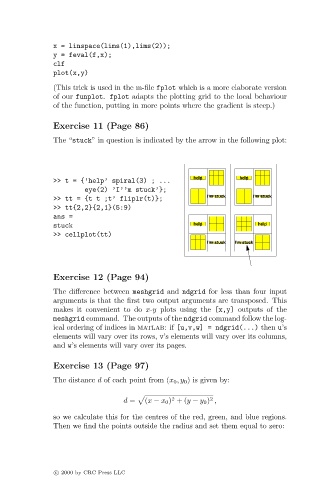
The “stuck” in question is indicated by the arrow in the following plot:
help help
>> t = {’help’ spiral(3) ; ...
eye(2) ’I’’m stuck’};
>> tt = {t t ;t’ fliplr(t)}; I’m stuck I’m stuck
>> tt{2,2}{2,1}(5:9)
ans =
stuck help help
>> cellplot(tt)
I’m stuck I’m stuck
Exercise 12 (Page 94)
The difference between meshgrid and ndgrid for less than four input
arguments is that the first two output arguments are transposed. This
makes it convenient to do x-y plots using the [x,y] outputs of the
meshgrid command. The outputs of the ndgrid command follow the log-
ical ordering of indices in matlab:if [u,v,w] = ndgrid(...) then u’s
elements will vary over its rows, v’s elements will vary over its columns,
and w’s elements will vary over its pages.
Exercise 13 (Page 97)
The distance d of each point from (x 0 ,y 0 ) is given by:
2
2
d = (x − x 0 ) +(y − y 0 ) ,
so we calculate this for the centres of the red, green, and blue regions.
Then we find the points outside the radius and set them equal to zero:
c 2000 by CRC Press LLC