Page 198 - Basics of MATLAB and Beyond
P. 198

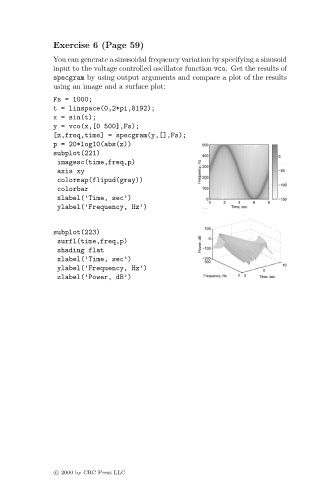
Exercise 6 (Page 59)
                               You can generate a sinusoidal frequency variation by specifying a sinusoid
                               input to the voltage controlled oscillator function vco. Get the results of
                               specgram by using output arguments and compare a plot of the results
                               using an image and a surface plot:

                               Fs = 1000;
                               t = linspace(0,2*pi,8192);
                               x = sin(t);
                               y = vco(x,[0 500],Fs);
                               [z,freq,time] = specgram(y,[],Fs);
                               p = 20*log10(abs(z))
                               subplot(221)
                                imagesc(time,freq,p)
                                axis xy
                                colormap(flipud(gray))
                                colorbar
                                xlabel(’Time, sec’)
                                ylabel(’Frequency, Hz’)


                               subplot(223)
                                surfl(time,freq,p)
                                shading flat
                                xlabel(’Time, sec’)
                                ylabel(’Frequency, Hz’)
                                zlabel(’Power, dB’)


                               c   2000 by CRC Press LLC
   193   194   195   196   197   198   199   200   201   202   203