
Page 194 - Basics of MATLAB and Beyond
P. 194
10: y = linspace(ycentre - L,ycentre + L,N);
0.13s, 0% 11: [X,Y] = meshgrid(x,y);
0.67s, 2% 12:Z=X+ i*Y;
13:Z0=Z;
14: for k = 1:50;
23.02s, 76% 15: Z = Z.^2 + Z0;
0.02s, 0% 16: end
0.36s, 1% 17: ind1 = find(isnan(Z));
0.43s, 1% 18: ind2 = find(~isnan(Z));
0.22s, 1% 19: Z(ind1) = 1;
0.08s, 0% 20: Z(ind2) = 0;
5.15s, 17% 21: contour(x,y,abs(Z),[.5 .5])
0.02s, 0% 22: grid;box
23: axis equal off
Most of the time here is spent iterating the values of Z. You can get
a plot of the time taken by the most time-consuming lines of code by
capturing the output of the profile command and using it to produce a
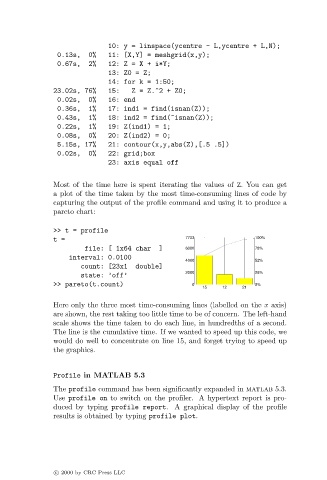
pareto chart:
>> t = profile
t= 7733 100%
file: [ 1x64 char ] 6000 78%
interval: 0.0100
4000 52%
count: [23x1 double]
2000 26%
state: ’off’
>> pareto(t.count) 0 0%
15 12 21
Here only the three most time-consuming lines (labelled on the x axis)
are shown, the rest taking too little time to be of concern. The left-hand
scale shows the time taken to do each line, in hundredths of a second.
The line is the cumulative time. If we wanted to speed up this code, we
would do well to concentrate on line 15, and forget trying to speed up
the graphics.
Profile in MATLAB 5.3
The profile command has been significantly expanded in matlab 5.3.
Use profile on to switch on the profiler. A hypertext report is pro-
duced by typing profile report. A graphical display of the profile
results is obtained by typing profile plot.
c 2000 by CRC Press LLC