
Page 192 - Basics of MATLAB and Beyond
P. 192
38.3 Debugging
matlab has a suite of debugging commands. A list of them can be
obtained by typing help debug:
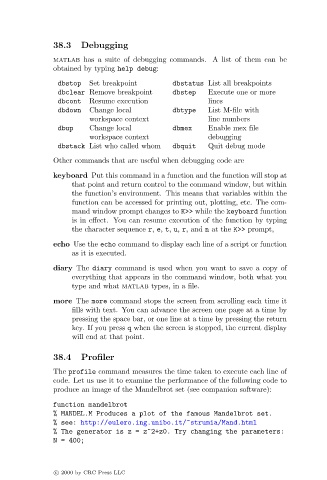
dbstop Set breakpoint dbstatus List all breakpoints
dbclear Remove breakpoint dbstep Execute one or more
dbcont Resume execution lines
dbdown Change local dbtype List M-file with
workspace context line numbers
dbup Change local dbmex Enable mex file
workspace context debugging
dbstack List who called whom dbquit Quit debug mode
Other commands that are useful when debugging code are
keyboard Put this command in a function and the function will stop at
that point and return control to the command window, but within
the function’s environment. This means that variables within the
function can be accessed for printing out, plotting, etc. The com-
mand window prompt changes to K>> while the keyboard function
is in effect. You can resume execution of the function by typing
the character sequence r, e, t, u, r, and n at the K>> prompt,
echo Use the echo command to display each line of a script or function
as it is executed.
diary The diary command is used when you want to save a copy of
everything that appears in the command window, both what you
type and what matlab types, in a file.
more The more command stops the screen from scrolling each time it
fills with text. You can advance the screen one page at a time by
pressing the space bar, or one line at a time by pressing the return
key. If you press q when the screen is stopped, the current display
will end at that point.
38.4 Profiler
The profile command measures the time taken to execute each line of
code. Let us use it to examine the performance of the following code to
produce an image of the Mandelbrot set (see companion software):
function mandelbrot
% MANDEL.M Produces a plot of the famous Mandelbrot set.
% see: http://eulero.ing.unibo.it/~strumia/Mand.html
% The generator is z = z^2+z0. Try changing the parameters:
N = 400;
c 2000 by CRC Press LLC