Page 193 - Basics of MATLAB and Beyond
P. 193

xcentre = -0.6;
                               ycentre = 0;
                               L = 1.5;
                               x = linspace(xcentre - L,xcentre + L,N);
                               y = linspace(ycentre - L,ycentre + L,N);
                               [X,Y] = meshgrid(x,y);
                               Z=X+ i*Y;
                               Z0=Z;
                               for k = 1:50;
                                 Z = Z.^2 + Z0;
                               end
                               ind1 = find(isnan(Z));
                               ind2 = find(~isnan(Z));
                               Z(ind1) = 1;
                               Z(ind2) = 0;
                               contour(x,y,abs(Z),[.5 .5])
                               grid;box
                               axis equal off

                               You must tell the profile command which function you want to look
                               at. The format of this command changed between matlab versions 5.2
                               and 5.3.


                               Profile in MATLAB 5.2
                               Initiate the profiler in matlab version 5.2 by typing:

                               profile mandelbrot
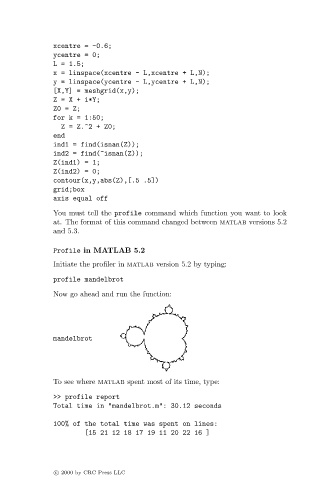
                               Now go ahead and run the function:


                               mandelbrot


                               To see where matlab spent most of its time, type:
                               >> profile report
                               Total time in "mandelbrot.m": 30.12 seconds

                               100% of the total time was spent on lines:
                                       [15 21 12 18 17 19 11 20 22 16 ]


                               c   2000 by CRC Press LLC
   188   189   190   191   192   193   194   195   196   197   198