
Page 25 - Basics of MATLAB and Beyond
P. 25
In this case we used plot to plot one vector against another. The
elements of the vectors were plotted in order and joined by straight line
segments. There are many options for changing the appearance of a plot.
For example:
plot(x,y,’r-.’)
will join the points using a red dash-dotted line. Other colours you can
use are: ’c’, ’m’, ’y’, ’r’, ’g’, ’b’, ’w’, ’k’, which correspond to
cyan, magenta, yellow, red, green, blue, white, and black. Possible line
styles are: solid ’-’, dashed ’--’, dotted ’:’, and dash-dotted ’-.’.
To plot the points themselves with symbols you can use: dots ’.’, circles
’o’, plus signs ’+’, crosses ’x’, or stars ’*’, and many others (type
help plot for a list). For example:
plot(x,y,’bx’)
plots the points using blue crosses without joining them with lines, and
plot(x,y,’b:x’)
plots the points using blue crosses and joins them with a blue dotted
line. Colours, symbols and lines can be combined, for example, ’r.-’,
’rx-’ or ’rx:’.
4.1 Plotting Many Lines
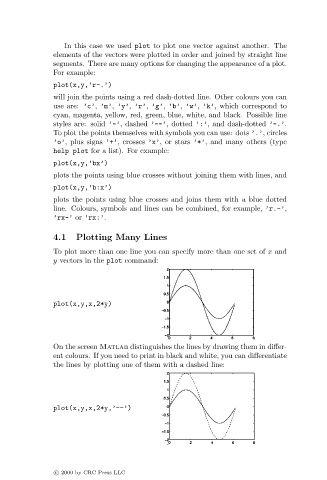
To plot more than one line you can specify more than one set of x and
y vectors in the plot command:
plot(x,y,x,2*y)
On the screen Matlab distinguishes the lines by drawing them in differ-
ent colours. If you need to print in black and white, you can differentiate
the lines by plotting one of them with a dashed line:
plot(x,y,x,2*y,’--’)
c 2000 by CRC Press LLC