
Page 26 - Basics of MATLAB and Beyond
P. 26
4.2 Adding Plots
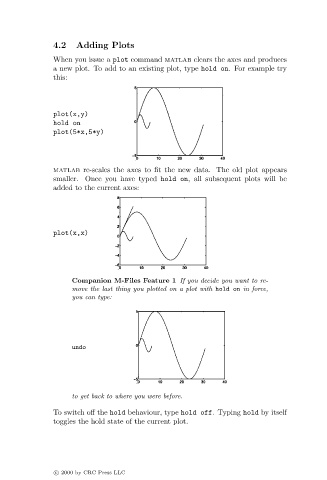
When you issue a plot command matlab clears the axes and produces
a new plot. To add to an existing plot, type hold on. For example try
this:
plot(x,y)
hold on
plot(5*x,5*y)
matlab re-scales the axes to fit the new data. The old plot appears
smaller. Once you have typed hold on, all subsequent plots will be
added to the current axes:
plot(x,x)
Companion M-Files Feature 1 If you decide you want to re-
move the last thing you plotted on a plot with hold on in force,
you can type:
undo
to get back to where you were before.
To switch off the hold behaviour, type hold off. Typing hold by itself
toggles the hold state of the current plot.
c 2000 by CRC Press LLC