
Page 28 - Basics of MATLAB and Beyond
P. 28
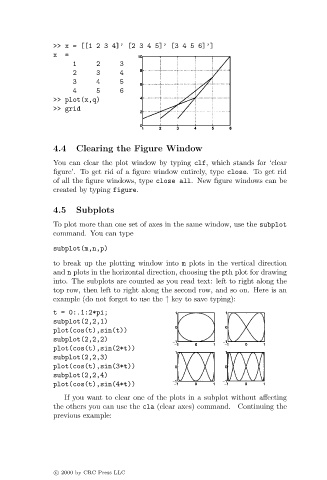
>> x = [[1 2 3 4]’ [2 3 4 5]’ [3 4 5 6]’]
                               x  =
                                    1     2      3
                                    2     3      4
                                    3     4      5
                                    4     5      6
                               >> plot(x,q)
                               >> grid


                               4.4   Clearing the Figure Window
                               You can clear the plot window by typing clf, which stands for ‘clear
                               figure’. To get rid of a figure window entirely, type close. To get rid
                               of all the figure windows, type close all. New figure windows can be
                               created by typing figure.

                               4.5   Subplots

                               To plot more than one set of axes in the same window, use the subplot
                               command. You can type

                               subplot(m,n,p)
                               to break up the plotting window into m plots in the vertical direction
                               and n plots in the horizontal direction, choosing the pth plot for drawing
                               into. The subplots are counted as you read text: left to right along the
                               top row, then left to right along the second row, and so on. Here is an
                               example (do not forget to use the ↑ key to save typing):
                               t = 0:.1:2*pi;
                               subplot(2,2,1)
                               plot(cos(t),sin(t))
                               subplot(2,2,2)
                               plot(cos(t),sin(2*t))
                               subplot(2,2,3)
                               plot(cos(t),sin(3*t))
                               subplot(2,2,4)
                               plot(cos(t),sin(4*t))
                                  If you want to clear one of the plots in a subplot without affecting
                               the others you can use the cla (clear axes) command. Continuing the
                               previous example:


                               c   2000 by CRC Press LLC