
Page 29 - Basics of MATLAB and Beyond
P. 29
subplot(2,2,2)
cla
As long as your subplots are based on an array of 9 × 9 little plots or
less, you can use a simplified syntax. For example, subplot(221) or
subplot 221 are equivalent to subplot(2,2,1). You can mix different
subplot arrays on the same figure, as long as the plots do not overlap:
subplot 221
plot(1:10)
subplot 222
plot(0,’*’)
subplot 212
plot([1010])
4.6 Three-Dimensional Plots
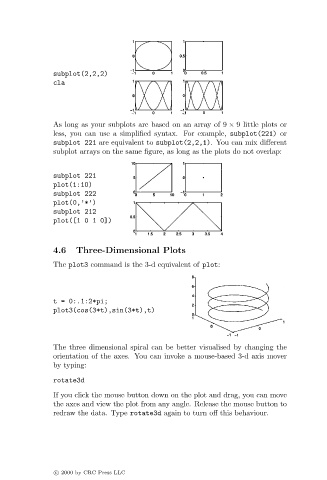
The plot3 command is the 3-d equivalent of plot:
t = 0:.1:2*pi;
plot3(cos(3*t),sin(3*t),t)
The three dimensional spiral can be better visualised by changing the
orientation of the axes. You can invoke a mouse-based 3-d axis mover
by typing:
rotate3d
If you click the mouse button down on the plot and drag, you can move
the axes and view the plot from any angle. Release the mouse button to
redraw the data. Type rotate3d again to turn off this behaviour.
c 2000 by CRC Press LLC