Page 30 - Basics of MATLAB and Beyond
P. 30

4.7   Axes
                               So far we have allowed matlab to choose the axes for our plots. You
                               can change the axes in many ways:

                                   axis([xmin xmax ymin ymax ]) sets the axes’ minimum and
                                                 maximum values
                                   axis square   makes the axes the same length
                                   axis equal    makes the axes the same scale
                                   axis tight    sets the axes limits to the range of the data
                                   axis auto     allows matlab to choose axes limits
                                   axis off      removes the axes leaving only the plotted data
                                   axis on       puts the axes back again
                                   grid on       draws dotted grid lines
                                   grid off      removes grid lines
                                   grid          toggles the grid
                                   box ∗         toggles the box
                                   zeroaxes ∗    draws the x-axis at y = 0 and vice-versa
                                                                ∗
                               The functions marked with an asterisk are nonstandard features, imple-
                               mented in this book’s companion m-files. 1

                               4.8   Labels

                               You can put labels, titles, and text on a plot by using the commands:
                                         xlabel(’text ’)
                                         ylabel(’text ’)
                                         zlabel(’text ’)
                                         title(’text ’)
                                         text(x,y,’text ’)  places text at position x,y
                                         gtext(’text ’)     use mouse to place text
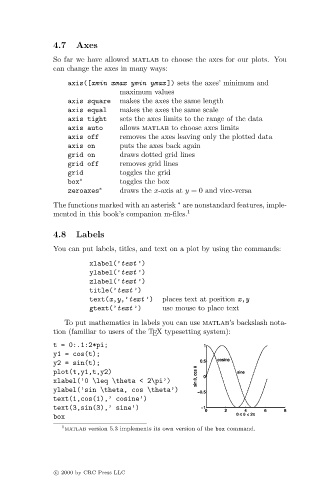
                                  To put mathematics in labels you can use matlab’s backslash nota-
                               tion (familiar to users of the T X typesetting system):
                                                         E
                               t = 0:.1:2*pi;
                               y1 = cos(t);
                               y2 = sin(t);
                               plot(t,y1,t,y2)
                               xlabel(’0 \leq \theta < 2\pi’)
                               ylabel(’sin \theta, cos \theta’)
                               text(1,cos(1),’ cosine’)
                               text(3,sin(3),’ sine’)
                               box
                                 1
                                  matlab version 5.3 implements its own version of the box command.


                               c   2000 by CRC Press LLC
   25   26   27   28   29   30   31   32   33   34   35