
Page 39 - Basics of MATLAB and Beyond
P. 39
z = 3*(1-x).^2.*exp(-(x.^2) - (y+1).^2) ...
- 10*(x/5 - x.^3 - y.^5).*exp(-x.^2-y.^2) ...
- 1/3*exp(-(x+1).^2 - y.^2);
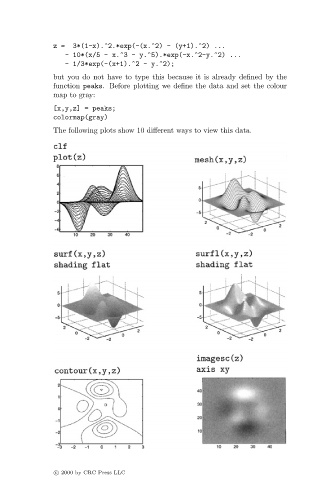
but you do not have to type this because it is already defined by the
function peaks. Before plotting we define the data and set the colour
map to gray:
[x,y,z] = peaks;
colormap(gray)
The following plots show 10 different ways to view this data.
c 2000 by CRC Press LLC