
Page 43 - Basics of MATLAB and Beyond
P. 43
The conclusion is that most viewers find it very difficult to interpret
these sorts of images; the cognitive switch from, for example, royg-
biv to amplitude is very slow and nonintuitive. A way out of this is
to use a palette of slightly varying, nonsaturated colours. These sorts
of colours have been used to create high-quality geographic maps for
many years. Most of matlab’s colour maps consist of highly saturated
colours (including the default colour map, which is jet(64)). It is bet-
ter to forgo these sorts of colour maps and stick with the calmer ones
such as gray, bone,or summer. The gray colour map has the added
advantage that printed versions will reproduce easily, for example, on a
photocopier. 2 The companion m-files include some other colour maps:
redblue, myjet, yellow, green, red, and blue.
To distinguish adjacent patches of subtly different colours, the eye
can be helped by enclosing the patches with a thin dark edge. The
contourf function, therefore, is an excellent way of displaying this sort
of data. 3
7.5 Extracting Logical Domains
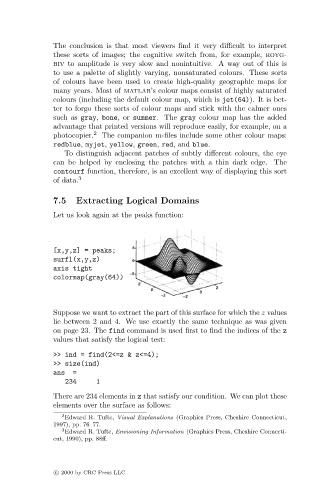
Let us look again at the peaks function:
[x,y,z] = peaks;
surfl(x,y,z)
axis tight
colormap(gray(64))
Suppose we want to extract the part of this surface for which the z values
lie between 2 and 4. We use exactly the same technique as was given
on page 23. The find command is used first to find the indices of the z
values that satisfy the logical test:
>> ind = find(2<=z & z<=4);
>> size(ind)
ans =
234 1
There are 234 elements in z that satisfy our condition. We can plot these
elements over the surface as follows:
2
Edward R. Tufte, Visual Explanations (Graphics Press, Cheshire Connecticut,
1997), pp. 76–77.
3 Edward R. Tufte, Envisioning Information (Graphics Press, Cheshire Connecti-
cut, 1990), pp. 88ff.
c 2000 by CRC Press LLC