Page 45 - Basics of MATLAB and Beyond
P. 45

x  =
                                   -1     0      1
                                   -1     0      1
                                   -1     0      1
                               y  =
                                    1     1      1
                                    2     2      2
                                    3     3      3


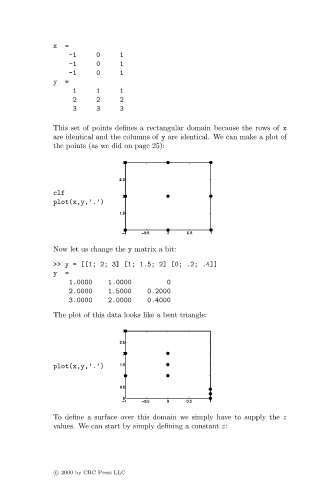
                               This set of points defines a rectangular domain because the rows of x
                               are identical and the columns of y are identical. We can make a plot of
                               the points (as we did on page 25):


                               clf
                               plot(x,y,’.’)


                               Now let us change the y matrix a bit:
                               >> y = [[1; 2; 3] [1; 1.5; 2] [0; .2; .4]]
                               y  =
                                   1.0000     1.0000         0
                                   2.0000     1.5000    0.2000
                                   3.0000     2.0000    0.4000
                               The plot of this data looks like a bent triangle:


                               plot(x,y,’.’)


                               To define a surface over this domain we simply have to supply the z
                               values. We can start by simply defining a constant z:


                               c   2000 by CRC Press LLC
   40   41   42   43   44   45   46   47   48   49   50